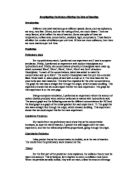
The two boxes below can be used to help explain why increasing the concentration increases the rate of reaction:
In the first diagram, there are fewer particles than in the second diagram for the same volume. This means that because all the particles are moving, there is more of a chance of the particles hitting into each other in the second diagram (diagram B). Therefore, there are more collisions per unit time, which lead to more reactions. Also, doubling the number of particles, will double the number of collisions, which will double the rate of the reaction.
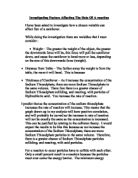
Another explanation of why when the concentration increases, so does the rate of reaction is draw a model. The diagram is as follows:
When the particles move randomly within the space, they collide with each other. Out of these collisions, it could be estimated that only about 2% of them actually react with each other. If for example, there are 100 black particles above and 100 white particles, in one minute, there could be 500 collisions. In fact, only 10 of them lead to a reaction. If there were 200 black particles and 100 white particles, then the amount of collisions would be double. Instead of there being 500 collisions, there would be 1000 collisions. Therefore, the amount of reactions would be 20. That is why I think that doubling the concentration will double the rate of reaction.
Variables Table
Safety
Throughout the whole experiment, safety goggles will be worn, as hydrochloric acid is harmful if someone gets it in their eyes. Also, any liquid spilt will be cleaned up straight away.
Apparatus
The apparatus for this experiment will be as follows:
-
2 x 50cm3 measuring cylinders
- 2 x teat pipettes
- 1 x conical flask
- 1 x weighing boat
- 1 x stopwatch
- 1 x spatula
- 1 x top pan balance
Method
Firstly, 25cm3 of hydrochloric acid was measured out using a measuring cylinder. The value was measured to the bottom of the meniscus. Then, 25cm3 of distilled water was measured out using the other measuring cylinder also, to the bottom of the meniscus. Then, both liquids were poured into the conical flask. Then, 0.5grams of calcium carbonate was measured in a weighing boat using a top pan balance. The calcium carbonate was added to the conical flask, and the time taken for all the calcium carbonate to disappear (as this is a solid, it will be easy to see when it has disappeared) will be measured using a stopwatch. This was then repeated for the following volumes of acid: 25cm3, 30 cm3, 35cm3, 40cm3, 45cm3 and 50cm3.
Results
Analysis
The graph supports my prediction, as when the concentration increases, so does the rate of reaction. The relationship between the two is proportional, because the line of best fit goes through the origin. Overall, the results were quite good as there weren’t any anomalies at all.
As far as the second part of my prediction is concerned, a table needs to be drawn to see if there is doubling. The table is as follows:
The values 2.075, 2.096 and 2.057 are all within 5% of 2 and they all show that there is doubling in this experiment. If the values were very accurate, then the results would be exactly 2. But, in this experiment, there is a 5% error.
The reason why the results are like this is because of the collision theory. This is because, for a reaction to occur, a collision must occur. When the particles actually collide, they will not react, unless the amount of energy the particles have, exceeds the activation energy. When the concentration is increased, more particles collide, so there is more chance of two particles, which have enough energy to form a reaction. Therefore, there are more collisions per unit time, which lead to more reactions.
The two boxes below can be used to help explain why increasing the concentration increases the rate of reaction:
In the first diagram, there are fewer particles than in the second diagram for the same volume. This means that because all the particles are moving, there is more of a chance of the particles hitting into each other in the second diagram (diagram B). Therefore, there are more collisions per unit time, which lead to more reactions. Also, doubling the number of particles, will double the number of collisions, which will double the rate of the reaction.
Another explanation of why when the concentration increases, so does the rate of reaction is draw a model. The diagram is as follows:
When the particles move randomly within the space, they collide with each other. Out of these collisions, it could be estimated that only about 2% of them actually react with each other. If for example, there are 100 black particles above and 100 white particles, in one minute, there could be 500 collisions. In fact, only 10 of them lead to a reaction. If there were 200 black particles and 100 white particles, then the amount of collisions would be double. Instead of there being 500 collisions, there would be 1000 collisions. Therefore, the amount of reactions would be 20. That is why I think that doubling the concentration will double the rate of reaction.
Evaluation
Overall, my results were actually quite good. Only one point wasn’t on the line of best fit and it wasn’t very far away from the line, it was only 0.5mm from the line. The correlation coefficient of the results was 0.993, which is very close to 1. The closer the value is to 1, the better the values lie on the line of best fit. If the value is larger than 0.95, then the results are good, so my results are actually very good.
I believe that my results justify both of the predictions. This is because the graph clearly shows that as the concentration increases, so does the rate of reaction. Also, the results show doubling, because the values 2.075, 2.096 and 2.057 are all close to 2.
To improve the accuracy of the experiment even more, more accurate stopwatches could be used and more accurate measuring cylinders would be used. Also, a shaking machine could be used to swirl the conical flask at the start of the reaction.
An alternative experiment would be to use all the same chemicals, but instead of measuring the time taken for the reaction, the amount of gas produced (carbon dioxide) would be measured, using the same equipment, but a gas syringe would be put over the conical flask and the amount of gas produced would be measured. Also, the mass lost in gas could be measured using a top pan balance. The experiment would be performed and the mass before and after the experiment would be measured.