2.2 Ohm’s Law
Ohm’s Law states that the current flowing through a conductor (in this case a wire) between two points is directly proportional to the potential difference (voltage) across the two points (see Figure 3) and inversely proportional to the resistance between them provided the temperature remains constant. More specifically, it states that the resistance is constant independent of the current. This theory was first presented by the German physicist Georg Ohm, who described measurements of applied voltage and current through simple electrical circuits containing various lengths of wire, which he published in 1827.
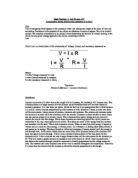
Ohm’s Law is summarised by the equation:
where I is the current through the conductor in units of amperes (A), V is the potential difference measured across the conductor in units of volts (V) and R is the resistance of the conductor in units of ohms (Ω).
In circuits, three equivalent expressions of Ohm’s Law can be used interchangeably:
The interchangeability of the equation may be represented be a triangle (see Figure 4), where V (voltage) is placed in the top section, the I (current) is placed in the left section and the R (resistance) is placed in the right section. The line that separates the left and right sections indicates multiplication, while the line that separates the top and bottom sections indicates division. For example, if the potential difference across a wire is 12V and the circuit has a current of 0.2A, the resistance in the wire will be 60Ω because 12 ÷ 0.2 = 60.
2.3 Standard Wire Gauge
Standard Wire Gauge (SWG) is an imperial set of sizes used to measure the diameter of electrical wire (see Figure 5). The basis of the system is the mil. The smallest size in the Standard Wire Gauge is 1 mil (0.001in), while largest size is 500 mil (0.50in). Standard Wire Gauge is also known as Imperial Wire Gauge or British Standard Gauge and has been in use in Britain since 1884, although cross sectional area in square millimetres is now a more popular wire size measurement.
Figure 5:
A Standard Wire Gauge
The conversion from Standard Wire Gauge to millimetres is as follows:
2.4 Factors
There are four main factors which affect the resistance in a wire. They are length, diameter, material and temperature. For this task we were permitted to investigate the first three factors as we did not have the necessary apparatus to study temperature.
Increasing the length of the wire increases the resistance because the free electrons must travel through more material and will therefore have more collisions with the atoms fixed in the wire. As a result, more energy will be lost as heat, increasing the resistance. We would measure the length of the wire in centimetres (cm).
However, increasing the diameter of the wire will decrease the resistance as it creates more space for the electrons to pass, making them less likely to collide with the atoms in the wire. We would measure the diameter of the wire in Standard Wire Gauge (SWG).
The choice of material also has an effect on its resistance. This is because different materials have different densities and higher density materials will block more electrons. For example, nickel chrome is denser than copper, so it has a greater resistance.
Finally, an increase in temperature results in an increase in resistance because the atoms in the metal oscillate more quickly, resulting in more collisions with free flowing electrons. Temperature is most commonly measure in degrees Celsius (°C).
3. METHOD
3.1 Equipment
1 metre of nickel chrome wire
1 metre of copper wire
1 metre of constantan wire
1 metre of manganin wire
1 × 24 volt power pack
1 × voltmeter
1 × ammeter
1 × metre rule
2 × crocodile clips
5 × circuit wires
Apart from deciding which parameter to investigate, we also had to choose the equipment that we would need to carry out our experiments. To ensure that we carried out our investigation independently, we were not given a set list of equipment to use. Instead, we were given a wide range of equipment from which to choose the things we needed and told to use our preliminary experiments to choose the best suited equipment for the task. This included four different wire materials (nickel chrome, copper, constantan and manganin), five different diameters of wire (0.16 SWG, 0.20 SWG, 0.28 SWG, 0.31 SWG and 0.36 SWG) and an unlimited range of lengths (within reason, as we only had limited amounts of test wire). The power in the circuit was generated by a 24 volt power pack. As there were no ohmmeters available to measure the resistance, we recorded the current in the circuit using the ammeter and the potential difference across the test wire using the voltmeter and used Ohm’s Law to calculate the resistance by dividing the potential difference by the current.
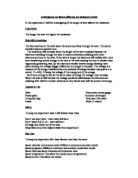
3.2 Circuit diagram
3.3 Procedure
The equipment was set up as shown in the circuit diagram, with the relevant test wire fixed to a metre rule. We pulled the test wire tight so that the current flowed through the exact length of wire that was intended. Firstly, we attached the crocodile clips to the wire, one at the 0 cm position on the metre rule and the other at the length we were testing. Next, we turned on the power supply and recorded the current off the ammeter and the potential difference off the voltmeter as shown on the diagram. This had to be done swiftly because the wires we were testing could warp if we left the power supply on for too long, potentially corrupting our results. After the power supply was turned off the second crocodile clip was moved to the next position. These steps were repeated for each length. We also repeated the entire investigation three times to achieve a greater accuracy.
3.4 Fair test
If our investigation was to be successful we needed to make sure that we were not corrupting our results in any way. Therefore, when we were testing our parameters and their effect on the resistance in a wire we ensured that all other factors that affect the resistance remained constant.
3.5 Safety precautions
When carrying out experiments, there can be a number of safety hazards. Our main concern was electrocution (see Figure 6). To avoid receiving electric shocks we only used wires that had insulation and were not bare. We also ensured that we were not in the near vicinity of any water sources and that the power supply was turned off before we handled the wires. In the unlikely event that someone was electrocuted, they would not have come to any serious harm because we kept the power pack at a low voltage (2V) at all times and did not tamper with it.
4. PRELIMINARY WORK
4.1 Summary
As part of our investigation, we conducted a number of preliminary experiments. The purpose of these were to help us decide which parameter we would investigate and what equipment we would use in order to optimise our experiment and achieve reliable results.
4.2 Parameters
We conducted preliminary experiments for length, diameter and material in order to help us decide which parameter we should investigate. Unfortunately, we were unable to control the temperature in our experiments, but this only changed by a few degrees in the course of the day and much less during the course of one set of measurements.
4.3 Experiments
We first measured the effect of the material, but kept the diameter of the wire constant at 28SWG. We tested four different wire materials: nickel chrome, copper, constantan and manganin. The length of the wire was kept at 50cm (see 5.1.1 Table1, graph 1). We next varied the diameter of the nickel chrome wire but he kept the length constant. We used five different diameters of wire (0.16 SWG, 0.20 SWG, 0.28 SWG, 0.31 SWG and 0.36 SWG) (see 5.1.1 Table 2, graph 2). This experiment was only carried out for one material. Lastly we varied the length of nickel chrome wire, but kept the diameter constant at 28SWG (see 5.1.2 Table 3, graph 3). This experiment was repeated for the final experiment but as the results were very similar, only one of the tables is shown.
4.4 Conclusions
Our preliminary results demonstrated that average resistance changes with the material used. Nickel chrome gave the highest resistance, then constantan and then manganin and finally copper giving the lowest resistance. The difference between the most and the least resistant material was about 3-fold.
With respect to the diameter of the wire, we found that the resistance increased linearly with wire thickness. The difference between the thinnest and thickest wire available was about 3-fold.
Lastly we found that there was a linear correlation between the length of the wire and its resistance. In this case, the measurements changed by 10-fold over the range we tested. As this was the greatest range of measurements we decided to investigate this further in the final experiment. If the difference in measurements is large, the experimental error is less noticeable.
5. FINAL EXPERIMENT AND RESULTS
In our final experiment we chose to investigate every material across a range of lengths from 10cm to 1 metre. We did not notice any distinct advantages or disadvantages five different diameters of wire (0.16 SWG, 0.20 SWG, 0.28 SWG, 0.31 SWG and 0.36 SWG) to using a particular diameter of wire, so we chose to use 0.28 SWG as it was in the middle of the range. This would mean that the resistance was neither too high nor too low to conduct our investigation. As there were no ohmmeters available to measure the resistance, we recorded the current in the circuit and the potential difference across the test wire and used Ohm’s Law to calculate the resistance by dividing the potential difference by the current.
5.1 Tables
5.1.1 Preliminary experiments
Table 1 – Material (constant 0.28 SWG, 50 cm):
Table 2 – Diameter (constant nickel chrome, 50 cm):
5.1.2 Final experiment
Table 3 – Nickel chrome wire (constant 0.28 SWG):
Table 4 – Copper wire (constant 0.28 SWG):
Table 5 – Constantan wire (constant 0.28 SWG):
Table 6 – Manganin wire (constant 0.28 SWG):
5.2 Graphs
5.2.1 Preliminary experiments
Graph 1 – Effect of varying the material on the resistance in a wire of constant diameter (0.28SWG) and length (50cm)
Graph 2 – Effect of varying the diameter on the resistance in a Nickel Chrome wire of constant length (50cm):
Graph 3 - Effect of varying the length on the resistance in a Nickel Chrome wire (0.28SWG):
5.2.2 Final experiment
Graph 4 – Effect of varying the length on resistance in different material wires (0.28SWG):
6. CONCLUSION
The graph clearly shows a strong positive correlation between the length and resistance of a wire. For example, the Nickel Chrome wire at a length of 10cm had an average resistance of 1.10Ω, but at the length of 100cm it was 10.76 Ώ. The graph clear shows that this is a linear relationship. If the length of the wire is increased, the resistance of the wire will also increases, because the further the electrons flow, the greater the chance that the electrons will collide with the conducting material. However, different materials have different resistance as illustrated by the fact that the gradient of the line changes with the material used. Nickel Chrome gives the steepest gradient since it is the densest material. In a denser material free flowing electrons have a higher likelihood of colliding with the atoms in the metal, thereby increasing the resistance. Of the materials used constantan has the second highest resistance, followed by manganin. Copper has the least resistance and the graph with the lowest gradient.
My conclusion supports the theory of resistance, which explains that there is a greater resistance in a longer piece of wire because free electrons carrying the current have more collisions with the fixed atoms in the metal, resulting in a loss of energy as heat.
7. EVALUATION
I am confident in my conclusion because this investigation produced very reproducible results. The spread of the data for each measurement point was very small. In fact, the graph does not show the range bars because the extent of scatter was minimal. However, there were a number of factors that could have reduced the accuracy of the results. Firstly, there was potential inaccuracy in the equipment used, which was not of the highest quality. This was demonstrated by the flickering readings in the ammeter and voltmeter when the current and potential difference was evidently not changing this fast. In addition to this, the wires available were not necessarily of uniform cross-sectional area which could have increased or decreased the resistance. We were unable to control this parameter. Furthermore there were a small number of outliers (Table 4, reading at 80cms) which were most likely due to human error during the measurements. The value obtained for the current was too high, possibly due to inaccuracy of the ammeter. However as we took an average of three readings, this outlier will not have affected our final results. Finally, the room temperature could easily have affected the resistance as it may have changed during the day. Although we completed the entire investigation in one day, there was a noticeable increase in temperature over the time period, which could have increased the resistance in the wires. However measurements with one material would have been completed within approximately 30 minutes, a time period over which the temperature is unlikely to have changed significantly. Therefore I am confident in our conclusion that the length of the wire increases the resistance. I am also confident that denser materials have higher resistance, but the exact values of this increase can only be estimated under more controlled conditions. If we were to repeat these experiments we would undertake them in a controlled temperature environment in a sealed room. Furthermore, it would be advisable to take more repeat readings in the future. If we look at Table 4, we can see the benefits of taking repeat experiments in order to eliminate outliers and arrive at reliable average results.