I will change the concentration of enzymes by changing the number of potato chips used in the investigation. Catalase is found in every potato cell; therefore, by increasing the number of potato chips, the number of potato cells would also be increased therefore the concentration of catalase would increase. The hydrogen peroxide will be kept at the same volume and the same concentration for each of the different enzymes concentrations
Hypothesis
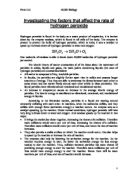
I hypothesise that the concentration of enzymes would be directly proportional to the rate of reaction, i.e. that doubling the concentration of enzymes would also double the rate of reaction. This is because there will be twice as many enzyme molecules. Therefore there will be twice as many successful collisions per unit of time; therefore, the reaction will be twice as fast. The graph of plotting the rate of reaction against the enzyme concentration should look like this:
At low enzymes concentrations the reaction is slow because there is no enough enzymes to break down the substrate. As the concentration increases, the rate of reaction increases in direct proportion. At point Y the rate of reaction does not increase in direct proportion as the extra enzymes per unit of volume would no longer make as much difference as there is already a high concentrations. At point X the reaction is the fastest possible under the current conditions as the line of the graph flattens out and the rate of reaction would not increase, no matter how much the enzyme concentrations increase the rate of reaction will not increase.
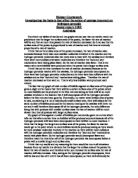
However, I am only investigating the straight–line part of the graph in which case the graph from my results should look like this.
Preliminary experiment
A preliminary to find out the most suitable equipment and the most suitable combination of phosphate buffer and hydrogen peroxide. Different combinations of phosphate buffer and hydrogen peroxide was used to see which would be the most effective. In addition spacing for the number of chips to be used were also tested, by using 1, 2, 3 chips in each tube. 9 chips - the maximum number of chips that was going to be used - was tested in a test tube, then a boiling tube to see whether the froth would overflow the tube.
The results of these tests are below:
These were used in the test tube
From the results of testing, it was decided that a 50:50 ratio of hydrogen peroxide and phosphate buffer will be used, therefore 6 cm3 of hydrogen peroxide and phosphate buffer measured and placed in the boiling tube. Also from testing, it was decided that a gap of 2 potato chips would be used instead of one, as the difference of 1 potato chip was within the margin of error, and a wider gap would provide a more distinct difference between the difference concentrations of enzymes
9 chips was decided to be the maximum as any more chips would have meant that the froth produced from the reaction would overflow the boiling tube. A gap of 2 chips was decided for the gap, as 1 chip in the preliminary experiment. Also from testing, it was decided that a gap of 2 potato chips would be used instead of one, as the difference of 1 potato chip was within the margin of error, and a wider gap would provide a more distinct difference between the difference concentrations of enzymes
2 graphs will be plotted from the results of the experiment, one plotting the time taken for the reaction against the product of the reaction – the height of the froth. The second will plot the enzyme concentration against the rate of reaction.
Plan - method 1
Apparatus
Below is the list of the apparatus that I plan to use and an explanation why I plan to use it:
- 5 boiling tubes - I plan to use five different concentrations of enzymes, from testing, it was discovered that test tubes were too small and the froth for higher concentrations of enzymes would spill over, thus boiling tubes, because of their higher capacity, were chosen.
- Millimetre calibrated rulers - these will have two functions, to measure out the length of the potato chips and the height of the froth in the boiling tubes. From testing it was found out that the differences in the height of the froth was very different for the different concentrations of enzyme, therefore mm was the smallest degree of accuracy required.
- Scalpels & cutting - these items of apparatus will be used cut the potato chips.
-
Two 10 cm3 measuring cylinders - these will be used to measure the hydrogen peroxide and the phosphate buffer. Only small amounts of the hydrogen peroxide and phosphate buffer will be used therefore, a high degree of accuracy is needed.
- Petite pipettes - as mentioned above, a high degree of accuracy will be needed to measure the amounts hydrogen peroxide and the phosphate buffer, for this reason petite pipettes will be used.
- Digital stop clock - the height of the froth will be measured at decided periods of time, therefore, a digital stop clock was needed for accurate timing.
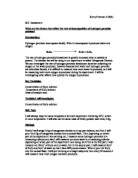
Diagram
The apparatus will be set up according to the diagrams below.
Method
The table below shows the set up for the different test tube.
The timer will be begin once the number of potato chips were dropped into the boiling tubes, and every 30 seconds for 5 minutes the height of the froth produced in the boiling tube will be measured. The results will be recorded for analysis. The experiment will end after 5 minutes.
To make sure the experiment is a fair test, all of the potato chips will be measured to 30 mm and as the chips are cut from the same chipper they will be of the same diameter. If the diameters or lengths were not the same, the number of potato cells will not be the same, and thus the concentration of enzymes would not be the same and therefore the experiment would not be fair. The phosphate buffer is added to make sure that the pH inside the boiling tubes will be constant. Any changes in the pH will affect the enzymes and would therefore disrupt the investigation.
Hydrogen peroxide can cause irritation, though this will cause no harm to the skin, it will however, cause harm to eyes. Therefore protective goggles must be worn when handling the hydrogen peroxide. If skin is exposed to hydrogen peroxide it must be washed. The boiling tubes will be placed in racks to stop them moving.
The independent variable in this experiment will be the number of potato chips used, and the dependent variable will be the height of the froth produced. The boiling tube will be equilibrated to make measuring the height of the froth more accurate.
The experiment will be repeated to give a better point of comparison, in addition the average will be calculated from the two reactions to make the results more reliable. There will also be a ‘control’ boiling tube where there will not be any potato chips, this will be used to see what would happen if there was not any catalase. This will also be a point of comparison with the different results
However this method is very inaccurate, as measuring the froth does not measure all of the oxygen released from the reaction. The froth does only measures some of the oxygen released from the reaction does not, as bubbles can collapse and bubbles have different sizes. These trap different amounts of gas and therefore is not a real indication of the gas produced in the reaction. In addition, if the rate of reaction is not fast enough to sustain the froth, it will collapse and the gas produced will be lost. Therefore a new method was planned for a more accurate way of carrying out the investigation.
Plan - method 2
Apparatus
The new method will use all the items of apparatus used in the previous method, but will also require new items of apparatus.
- Water trough - a water bath will be needed to keep the temperature constant, it will also provide water for collecting gas by using displacement.
-
50 cm3 measuring cylinders - these measuring cylinders will be filled with water, the gas released from the reaction will displace the water and the gas collected will measured using the measuring cylinder. Testing has shown that no more 50 cm3 of gas will be released from the reaction, therefore this will be suitable.
- Delivery tube - this will be used to transport the gas released from the reaction o the measuring cylinder to be collected.
- Rubber bungs - these bungs will be used to seal the boiling tubes, preventing and gas released from the reaction escaping.
- Retort stand & clamps - these items of apparatus will be used to hold the boiling tubes and the measuring cylinders in position.
Diagram
Method
The timer will be begin once the number of potato chips were dropped into the boiling tubes, and every 30 seconds for 5 minutes the height of the froth produced in the boiling tube will be measured. The results will be recorded for analysis. The experiment will end after 5 minutes.
The same content will be placed inside the boiling tubes as before. The timer will still start when the chips are dropped into the boiling tubes. However, this time, the gas released from the reaction will be bubbled through water into the measuring cylinder. Oxygen is very insoluble in water and it will displace water in the measuring cylinder. As it is less dense than water it will rise to the top, and the volume of gas can be measured and the results can be recorded.
To make sure the experiment is a fair test, all of the potato chips will be measured to 30 mm and as the chips are cut from the same chipper they will be of the same diameter. If the diameters or lengths were not the same, the number of potato cells will not be the same, and thus the concentration of enzymes would not be the same and therefore the experiment would not be fair. The phosphate buffer is added to make sure that the pH inside the boiling tubes will be constant. Any changes in the pH will affect the enzymes and would therefore disrupt the investigation.
In addition to the devices set up in the previous method to make sure that investigation is a fair test, the reaction will also be put into a water bath to keep the temperature of the reaction constant. The temperature is the average speed at which the particles move, the higher the temperature, the greater the speed. The particles of reactant collide and release enough energy a reaction occurs. Particles moving at greater speed would have a greater chance of colliding, but also, as they are moving at a greater speed, they have greater kinetic energy. This increases the number of successful collisions per unit of time, thus increases the rate of reaction. That is why it is very important to keep the temperature of the reaction constant.
The independent variable in this experiment will be the number of potato chips used, and the dependent variable will be the height of the froth produced. The boiling tube will be equilibrated to make measuring the height of the froth more accurate.
The experiment will be repeated to give a better point of comparison, in addition the average will be calculated from the two reactions to make the results more reliable. There will also be a ‘control’ boiling tube where there will not be any potato chips, this will be used to see what would happen if there was not any catalase. This will also be a point of comparison with the different results
Hydrogen peroxide can cause irritation, though this will cause no harm to the skin, it will however, cause harm to eyes. Therefore protective goggles must be worn when handling the hydrogen peroxide. If skin is exposed to hydrogen peroxide it must be washed. The boiling tubes will be placed in racks to stop them moving.
For both experiments there will be a control boiling tube where there will not be any potato chips put in, only hydrogen peroxide and phosphate buffer.
Results
Method 1
Method 2
Graphs are also included in this investigation.
Temperature for both experiments was at 170C.
For both experiments no reaction took place in the control boiling tubes, where no potato chips was added.
Analysis
Looking at the figures in the table of results alone, we can see that the froth is produced at a much faster rate for 9 chips than at 1 chip. After 30 seconds, the average height of froth was just 1.5mm in the boiling tube with only 1 potato chip, but in the boiling tube with 9 potato chips, the average height if the froth produced was 23 mm. We can see that this is much greater. This is also supported by the results obtained from method 2. The average volume of gas released from the reaction with only 1 chip after 1 minute was 1 cm3, in the reaction with 9 potato chips, the average volume of gas released from the reaction was 9 cm3. In both methods, the rate of reaction for 1 chip was much slower than the rate of reaction for 9 chips.
The trend in the figures can be seen more clearly by plotting graphs. From the graphs graph showing the results obtained from the investigation, we can see that the rate of reaction is clearly greater for the higher concentrations of enzymes. The rate of reaction is represented by the gradients of the lines of best fit in the graphs plotting the product against time. It be can seen that the average gradient of the line representing the reaction with 9 potato chips is much steeper than the gradient of the line representing the reaction with only 1 potato chip. This shows that for higher concentrations, the rate of reaction is higher.
However, there is a clearer method of demonstrating. Using the equation:
R is the rate of reaction, P is the product of the reaction (in method 1 the product measured was the froth – its height, in method two the product of the volume of gas produced from the reaction), and t is the time elapsed, the average rate of reaction can be calculated and it can be plotted against the rate of reaction. From the graphs plotted, it can be seen that the rate of reaction is directly proportional to the concentration of enzymes. This can be seen from the line of best fit which is a straight line, meaning that the relationship between the rate of reaction and the concentration is: R = k x C where R id the rate of reaction and k is the scale factor, C is the concentration of enzymes. Therefore if the concentration of enzymes doubles, the rate of reaction also doubles.
Enzymes are specific catalysts; they only broke down one type of substance. This was because there was an active site on the enzyme that only fitted one substance, and on this active site, the reactions were sped up. This was very similar to a lock and key, the enzyme being the key, and the substrate being the lock. Only the right enzyme helped to speed up the reaction, however, the enzyme was not used in the reaction and was free to take part in the next reaction. The enzyme combined with the substrate, allowing the reaction to take place at much lower activation energy. The activation energy is the energy required to break the chemical bonds in reactants. With a lower activation energy the reaction took place more often. Once the chemical bonds are broken, the complex was no longer able to fit in the active site, and broke up. The enzyme was then free to take part in the next reaction.
There, a conclusion that the concentration of enzymes is an important factor that affects the rate of breakdown of hydrogen peroxide can be drawn from the results obtain in the investigation.
Working on the principles of the kinetic theory, the greater the concentration of enzymes, the faster the rate of reaction. This is because with higher concentration of enzymes, the grater number of molecules of enzymes per unit of volume. As there are more enzyme molecules, there is a greater possibility of a successful collision between the substrate and the enzyme, and therefore there are more successful collisions per unit of time, thus a faster rate of reaction.
The first diagram the rate of reaction is slow because there is not enough enzymes to break down the substrate, this was the case for the first boiling tube where there was only 1 potato chip. The second diagram shows the fastest rate possible under current conditions as there is no excess substrate and there are enough enzymes. None of the boiling tubes reached this scenario because as indicated in the hypothesis section only the straight-line part of the graph would be investigated. Once this point is reached, only by changing other limiting factors such as temperature, would the rate of reaction increase. The third diagram shows when there is an excess of enzymes and increasing the concentration enzyme has not increased the rate of reaction, it is till the same as the rate of reaction as the scenario in the second diagram.
Though not all of the points plotted were exactly on the lines of best fit in all 4 graphs, there were no real anomalous results found in the graphs as all of the points were either on or very close to the line of best fit.
The graphs plotting the rate of reaction against enzyme concentration matched the shape of the graph that I had predicted in the hypothesis section. This therefore supports my prediction that the rate of reaction is directly proportional to the concentration of enzymes, as the line from the graph is also a straight line.
This can also be supported by looking at the numerical values of the results of the investigation. In method 1 the rate of reaction for 1 chip was 2.1 mm/min. The rate of reaction for 3 chops was 6.7 mm/min, this was very close to the value of 6.3 mm/min working on the prediction. In addition, the result for 5 chips: which should be 10.5 mm/min, it was in fact 11.4 mm/min, which was also very close.
The same trend is also seen in the table of results for method 2: the rate of reaction for 1 chip is 0.9 cm3/min; the rate of reaction for 3 chips was 3.25 cm3/min, very close to the projected figure of 2.7 cm3/min according to the prediction. This trend is also seen for the rest of the investigation such as for 9 chips: where the rate of reaction was 8.5 cm3/min, very close to the estimated figure of 8.1 cm3/min according to the prediction.
Evaluation
On the whole the investigation was a success. The aim of the investigation was to find out the factors that affect the rate of breakdown of hydrogen peroxide, from the results obtained a conclusion was drawn, which had supported the initial hypothesis. Therefore the investigation can be seen as a success because the aim of the investigation was reached.
Looking at the tables displaying the results obtained from the investigation, it is seen that the values of the repeats are very similar to each other. Therefore, it can be concluded that the results obtained agree with each other. In addition, the results obtained from method 1 also seem to agree with the results obtained from method 2. Although this cannot be seen from the values in the tables of results as they measure different things, the graphs displaying the results and the relationship between the rate of reaction and enzyme concentration both display a line of best fit that is a straight line of similar shape.
Based on the evidence above, it can be concluded that the results obtained from the investigation is reliable enough for a conclusion to be drawn from it. However, 3 sets of results would be better to see any anomalous results. With 2 sets of results, it is impossible to determine which set is incorrect, but with an extra set of results, there is another point of comparison. Perhaps, if the investigation could be carried out again, it would be better to repeat the reaction twice instead of once, as it would improve the reliability of the results obtained from the investigation.
The results, though they were not completely accurate, were sufficiently accurate and reliable enough from which that a conclusion could be drawn. This is because that they were taken carefully and accurately recorded, to a high degree of accuracy. The degree of accuracy was high enough for the investigation as it was enough to show the differences between the concentrations of enzymes.
If the investigation could be carried out again, there are some alterations that could be made concerning the accuracy of the investigation:
- Firstly instead of measuring the volume of hydrogen peroxide, mass is a measure of how many molecules of hydrogen peroxide are present. This is a more accurate method of measuring the hydrogen peroxide than the volume. Measuring the volume is not completely accurate and does not accurately ensure that there are the same number of hydrogen peroxide molecules in each boiling tube, if the mass was measured this would be more accurate.
- The product of the investigation (height of froth, and volume of gas) could be measured more frequently; this would have given greater accuracy to the graphs that was produced from the results obtained. More points on the graph would mean a more accurate line of best fit. This would therefore lead to a better representation of the results obtained from the investigation.
The first method used, was less accurate than the second method because the first method did not measure the oxygen released from the reaction. The froth, made up of bubbles tapping gas, were only an very inaccurate indication of the amount of gas released from the reaction, as they could not trap all of the gas. In addition bubbles collapsed during the reaction, and the gas that escaped from this could not be measured by this method.
The second method was a much more accurate method than the first method as it measured all of the gas that was released from the reaction. Bubbling the gas from the boiling tubes made sure that none of the gas was able to escape; however, a minute amount of the gas would have dissolved into the water. Despite this, the second method was the best method with the equipment available.
However, there are some improvements to this method that would be made if the investigation could be carried out again:
- Instead of only measuring the gas that was released from the reaction, the amount of oxygen produced from the reaction would also be measured. The difference between the mass of the boiling tube before and after the reaction would be calculated, this would be the mass of the oxygen produced (the law of conservation of matter). This would improve the reliability and accuracy of the reaction as the water in which the gas is bubbled though will dissolve a minute amount if the gas.
- The reaction would have been repeated more times and the average value taken from them. This would make the results obtained from the reaction more reliable as the greater number of results from which to take the average would be affected less by anomalous results. The greater number of results obtained from the investigation, the more reliable the average of the results.
All of the results were either exactly on the line of best fit or were very close to the line of best fit. There were not outstanding points on the graph, therefore there were no anomalous results from the investigation. However, as already stated that not all of the points were on the line of best fit, this could be accounted for by human error during the reaction, such during the measuring of the gas collected or the height of the froth produced from the reaction.
There were 10 readings in all for each of the enzyme concentrations to draw the graphs. There were enough results to draw accurately a line of best fit, these lines of best fit, were sufficient in pointing out a conclusion. As there were 2sets of results, there were enough correct results collected to draw a conclusion.
There is one extension to the investigation in particular that could be carried out. As only the straight-line part of the graph of the relationship between the rate of reaction and the concentration of enzymes, an extension would be to investigate the point at which the graphs gradient begins to decrease and gradually decreases so that increasing the concentration gradient of enzymes would not have increased the rate of reaction.
This would mean increasing the number of chips up to 75 chips. But the scale of the investigation would have to increase as the boiling tube would not be able to take 50 potato chips. Or instead of adding potato chips, the enzyme catalase itself could be added. This would be a better way of measuring the amount of catalase breaking down the hydrogen peroxide. The gap of chips would continue to be 2 chips, starting from 1 chip to 3 chips to 5 chips and etc. I think continuing to 75 chips would usually allow me to obtain results that would allow me to find out at what enzyme concentration Point X on the graph below will be reached.
However, as time was limited for this investigation, it was not possible to carry on the experiment to that extent. And the graph plotting the rate pf reaction against the concentration of enzymes was still a straight line.
This would involve using the second method of the investigation, but with the improvements that has already been suggested. There would be more repetitions of the investigations, and the amount of hydrogen peroxide be measured as well as the amount of oxygen released from the reaction. The reasons for these modifications to the method have already been given.