1 lead crocodile clip
5 plug to plug wire
ruler
Nichrome wire
As shown, in the above diagram, I used a ruler to stretch each thickness of wire along the ruler (attached by cello tape). Attached to the wire was the crocodile clip which connected to the ammeter and the power pack. The voltmeter was connected in parallel with the plug to plug wires. I measured the current and p.d. for each length (20, 40, 60 and 80 cm) by placing one end of the plug to plug wire from the power pack onto the correct measurement (from the ruler) of the wire. After this was repeated for each measurement and each thickness of wire, I calculated the resistances using the formula R = V/I.
My results for this can be seen in the results table below.
Results for Preliminary Work
The preliminary work has helped me to plan my actual investigation, because it has enabled me to choose the thickness of wire with the most evenly, largest spread of resistances. I found this thickness of wire to be 36 swg. I will hopefully obtain a fairly accurate set of results from this thickness of wire because it has the largest range of resistances which were the most evenly spread from the 4 thicknesses I chose to investigate for the preliminary work.
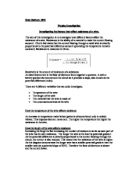
The Main Experiment – How length affects the resistance of a metal wire
Diagram: power pack Apparatus:
power pack
ammeter
voltmeter
metre rule
cello tape
ruler 1 lead crocodile clip 5 plug to plug wire
Nichrome wire
As I have already explained, nichrome wire is being used in the experiment because it has the largest, even range of resistance, which helps my investigation to be as accurate as possible. Nichrome metal wire is also commonly used in the heating of elements, which makes it both suitable and safe to use in my investigation, as it is unlikely to overheat whilst the experiment is commencing. The power pack is used in many science experiments (rather than batteries) and my investigation because of its versatility as you can alter the voltage by the ‘flick of a switch’. As well as being versatile the power pack is also a reliable power source as the voltage never runs out because it is plugged into the mains and it is also easy to connects wires to. These positive points add to the accuracy of my investigation as they help to prevent loss of power or a less constant flow of electricity. Ensuring that recordings of readings are taken clearly also improves the accuracy of the experiment.
Method
The basic steps of carrying out my experiment, to investigate how the length of a piece of wire affects the resistance, are very similar to how I conducted the preliminary work. The only differences are that I will use the thickness of wire that I found to have the most widely, evenly spread resistances (this was 36swg) – decided after completing the preliminary work. And I will calculate the resistance from the current and p.d. for 6 different lengths of wire as supposed to 4, which will increase the accuracy of my experiment and investigation on a whole. These lengths will be quite evenly spread at 10, 20, 40, 60, 80 and 90cm on a 1m rule, which will also increase the accuracy of my investigation.
In this experiment to test how the length affects the resistance of a piece of wire…
-
Length is the independent variable – what I will change
-
Current and voltage are the dependant variables – what I will observe and measure.
-
The control variables will be the thickness of wire, voltage on the power pack (2V and no higher to avoid over-heating of the wires and affecting the resistance and the temperature). These control variables will be kept the same to ensure a fair test.
In addition, the investigation will be repeated to obtain 3 sets of results. Repetition of results will make my overall set of results more reliable (by achieving a greater level of accuracy) and allowing finding any possible anomalies.
Safety Procedures
I will ensure that my investigation is safe by making sure there is no water by the electrics and the wire doesn’t overheat.
Accuracy
My readings will be kept as accurate as possible by measuring the current and p,d, in the same place and with the same degree of pressure for each length each time the current and p.d. are recorded. The power pack will also be kept at a constant voltage of 2V. As I have already mentioned, the readings will be repeated twice to obtain 3 sets of results for each length of wire, so that the results are accurate and I can analyse and explain accurately what I have found from the investigation in order to make a reliable conclusion.
Results (for the main experiment)
Thickness of wire used: 36swg
Analysing and considering my evidence and drawing conclusions (A)
Graphs of Results
To enable my interpretations and analysis of results to be more accurate, creating graphs of my results for the main experiment is necessary. I will create my graphs in Excel to show how the length of a piece of Nichrome wire (of thickness 36 swg) affects the resistance, current and voltage. Below is a copy of the spreadsheet (and the spreadsheet with formulas) I used to create the graph as well as the graph it self. I have chosen to use a scatter graph to show the range of results in an efficient way. I intend to create averages of the current, voltage and resistance to enable me to create 3 graphs;
- Resistance
- Current
- Voltage
Spreadsheet results table
From the above results table, I can identify that there were no anomalous results calculated from the main experiment.
Spreadsheet with Formulas-results from main experiment
Here is a copy (from excel) of the table I used to create the 3 graphs:
Averages
... and the formula table used to generate the averages:
Averages (formulas)
Analysis of Results
After having completed my graphs for length against resistance, current and voltage, I can now identify a significant pattern in my results.
Explanation of results for Length v Resistance
This is that as the length of the piece of Nichrome wire increases, so does its resistance. Even though I averaged out each attempt’s results, this pattern is evident in all 3 attempts of the experiment, and therefore there is a strong, positive correlation. Some examples to support this interpretation are shown below:
-
1st attempt – Length of wire = 20
Resistance calculated = 4.2
Length of wire = 60
Resistance calculated = 10.6
-
2nd attempt – Length of wire = 60
Resistance calculated = 11.6
Length of wire = 90
Resistance calculated = 17.5
-
3rd attempt – Length of wire = 10
Resistance calculated = 2.1
Length of wire = 40
Resistance calculated = 11.5
This pattern in my results supports my prediction that as the length of wire increases, so does its resistance. I have also observed, from my table of results, that the resistance also doubled, when doubling the length. An example of this pattern is in some of the results for attempt 3:
- When the length was 10cm, the resistance was 2.1 ohms
- When the length was 20cm, the resistance was 4.0 ohms
- When the length was 40cm, the resistance was 8.3 ohms
- When the length was 80cm, the resistance was 15.6 ohms
The above results support my finding.
In addition, from scientific knowledge, I made my prediction and so expected it to be correct. The resistance of a wire increases as its length increases because:
- The electrons have further to flow
- This takes longer
- Causing the current to slow down
Similarly, this is reversed when you decrease the length of wire, i.e. the resistance decreases.
This is true as the equation which relates resistance, current and voltage: R = V/I proves that in order for the resistance to increase, the voltage has to increase and the current has to decrease. These correlations are shown on the other 2 graphs (length v current and length v voltage) and explained later on in this analysis.
Explanation of Results for Length v Current
The scatter graph comparing the relationship between the length of a piece of Nichrome wire and the current flowing through it is shaped as a curve, with a negative correlation. This suggests to me that there is a natural decay of current as the length of the wire is increased. Some examples from my original results table, to support his finding, are stated below:
- When length was 10cm, current was 0.53 amps
- When length was 60cm, current was 0.13amps.
Moreover, if I were to consider extreme values (not tested in the experiment) they would also support my analysis even more strongly, e.g.
- If length was 0cm, current would be infinitely high, due to no resistance of the wire.
- If there was an infinite length, current would be 0 amps, due to an infinite resistance.
These observations from the table and graph, support the scientific evidence, mentioned earlier in my introduction, that as resistance is increased (i.e. also length increased as I have proved from my first graph – length of wire increases as does its resistance) less current will flow and vice versa.
So I can say that the relationship is not proportional, but inverse and disproportional.
Explanation of Results for Length v Voltage
As I used a power pack to supply a voltage to the experiment, voltage evidently remained relatively constant, despite the change in length of the Nichrome wire. My third graph, representing the relationship between the length of a piece of wire and the voltage of the wire, indicates this.
Some examples from my original results table are indicated below:
- When length was 10cm, voltage was 1.12 volts
- When length was 20cm, voltage was 1.26 volts
- When length was 40cm, voltage was 1.34 volts
The three above results were taken from my attempt 1 of the experiment.
However, after having viewing the above results, I have noticed that as the length of the wire increases, the voltage or p.d. increases, but at a very slow rate. But, I can suggest that this is due to slight inaccuracy when taking the recordings of results in the experiment.
From the graph produced, I can see a poor, but positive correlation, so as the length of wire increases; the voltage across it also increases, but more previously stated, at a much slower rate than resistance.
Conclusion of ResultsAfter having thoroughly analysed my results, shown in all 3 graphs, I feel I can now make a valid conclusion. Firstly, from my graphs of results, I can summarise that:
- As the length of wire increases, so does its resistance. The increase is proportional, i.e. if length doubles, so does resistance. This conclusion can be explained by scientific evidence, listed previously in my introduction, which states that as the length of a piece of wire is increased, the electrons have further to flow. This takes longer and causes the current to slow, hence the resistance increase.
- As the length of wire increases, current decreases. This relationship is inverse and disproportional. As mentioned in 1) when the length of wire increases, the resistance also does. This means that current decreases as the electrons, within the metal wire, have further to flow and so take longer, i.e. slowing down the current. From scientific knowledge, stated in my introduction, I know that current is the flow of electrons.
- From scientific knowledge, I know that in order for voltage to increase, resistance also has to increase. I have already proved that resistance increases proportional to length increasing, earlier on in this conclusion. Therefore, I would expect voltage to increase as the length of wire was increased. However, as explained in my main analysis, voltage remained relatively constant. I identified that this was because a power pack (battery) was used to supply voltage. Voltage only slightly fluctuated and I observed this was due to a bit of inaccuracy in recordings of the results for voltage.
Finally, as stated previously, after having drawn a line (or curve) of best fit on my 3 graphs, I can clearly prove that there were no anomalous results, indicating that the way in which I conducted the experiment was very accurate.
Evaluating my Evidence (E)
Evaluation of Results
I think that the results I obtained from the experiment were very reliable. I think this because I discovered no anomalous results and, as explained in my analysis, my 3 graphs for length v resistance, current and voltage, all fitted a pattern. Furthermore, I took recordings for 3 different attempts; this was, as already explained, to ensure a high degree of accuracy in the results was obtained. I also acquired this high degree of accuracy by using a thickness of wire (36 swg), which I found by carrying out the preliminary work, to have a widespread range of resistances. If I were to carry out the experiment again, I would expect to obtain very similar results, because of the accurate recordings, which were evident when I came to producing graphs and analysing from them. Therefore, I believe that the conclusion I made at the end of my analysis of results, was a firm conclusion. This belief is supported by proof of scientific evidence, in reference to my introduction.
Improvements
Even though, I believed the experiment was carried out in quite a fair way, and lots of precautions were taken to hopefully obtain good, accurate and reliable results, I can consider improvements I would make if I were to carry out the investigation again. These are bulleted below:
- I would ensure that the same person took recordings for current and the same person for voltage each time recordings were taken. This would be to attain more accurate results.
- Also the recordings for current and voltage would be taken at precisely the same time and make the results even more reliable and the test fairer.
- Use larger scale voltmeter and ammeters – greater accuracy
Further Work
In order to make my conclusion even more valid, I would need to extent my investigation for investigating how length affects the resistance of a piece of metal wire. To do this, I could:
- Use different types of wire, other than Nichrome wire.
- Extend the number of wires tested
- Have the experiment carried out by a large number of people
Furthermore, if I were to further the investigation, I could experiment how other factors affected the resistance of a metal wire. For example, as listed in my introduction: the cross-sectional area of the wire and the temperature of the wire.
Bibliography
Listed below are books and websites, etc (resources) which aided my completion of this investigation:
- “Physics For You” (textbook from school)
- Microsoft Word XP and Excel XP
- AQA Modular Science “The Early Modules” (CGP Revision Guide)