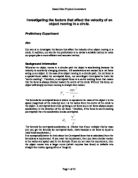
Objects moving in uniform circular motion will have a constant speed. Speed is a scalar quantity and velocity is a vector quantity. Velocity, being a vector, has both a magnitude and a direction. The magnitude of the velocity vector is merely the instantaneous speed of the object; the direction of the velocity vector is directed in the same direction that the object moves. Since an object is moving in a circle, its direction is continuously changing. At one moment, the object is moving northward such that the velocity vector is directed northward. One quarter of a cycle later, the object would be moving eastward such that the velocity vector is directed eastward. As the object rounds the circle, the direction of the velocity vector is different than it was the instant before. Therefore, while the magnitude of the velocity vector may be constant, the direction of the velocity vector is changing. The best word that can be used to describe the direction of the velocity vector is the word tangential. The direction of the velocity vector at any instant is in the direction of a tangent line drawn to the circle at the object's location. (A tangent line is a line that touches the circle at one point but does not intersect it.) The diagram at the right shows the direction of the velocity vector at four different points for an object moving in a clockwise direction around a circle. While the actual direction of the object (and thus, of the velocity vector) is changing, its direction is always tangent to the circle.
To summarize, an object moving in uniform circular motion is moving around the perimeter of the circle with a constant speed. While the speed of the object is constant, its velocity is changing. Velocity, being a vector, has a constant magnitude but a changing direction. The direction is always directed tangent to the circle and as the object turns the circle, the tangent line is always pointing in a new direction. As we proceed through this unit, we will see that these same principles will have a similar extension to noncircular motion.
Prediction
I predict that the larger the radius of the circle the faster the bung on the end of the string will turn. I also predict that the increase in speed of the turning bung will be directly proportional to the increase in size of the radius. Therefore, as the radius increases the velocity should decrease in direct proportion to our enlargement in radius.
I predict this because Where f = force, m = mass, v = velocity and r = radius Therefore, the velocity squared will be directly proportional to the radius.
Diagram
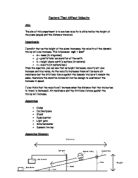
Method
For this experiment, firstly we set up the experiment as in the diagram. We measured the length of the wire from the end of the plastic tubing to the centre of mass of the bung. The weight at the bottom of the experiment was set to 100g. We used 30cms as the initial length and timed the time it took to do 20 rotations on a horizontal plane. We used a stopwatch to record the timing and relied on human reaction to make the results accurate. To make sure the rotations were counted correctly we lined it up with an object in the background so it would be easier to pick out and see the one full rotation.
Variable: Radius of the Orbit
Apparatus
Bung
Tube
Crocodile Clip
Weights
Wire
Stop Clock
Metre Ruler
Preliminary Results
Preliminary Conclusion
From these results, we can conclude that they show us what kind of results we should expect from our main experiment. They show that as the length of distance x increases, so does the time it takes to do 20 rotations. This helps our main experiment because we know now that using 20 rotations sometimes gives a very short reaction time of about 0.7s, which would be significant. Therefore, by increasing it to a larger amount of rotations we can increase the accuracy.
Main Experiment
Prediction
I predict that as the length of wire increases the force applied upon the wire will increase, thus the longer it will take the bung to complete the amount of rotations. This is backed up by what we have recorded in the preliminary results and the background knowledge. The formula, which reinforces my prediction, is:
Where f = force, m = mass, v = velocity and r = radius
Diagram
Plan
The experiment will be set up as in the diagram. The length of the wire from the end of the plastic tubing to the centre of mass of the bung will be controlled and measured to the centre of mass of the bung. This will be our variable for the experiment. The weight placed on the bottom will be set to 100g. We used 20cms as our initial length and timed the time it took to do 40 rotations. When rotated great care would be taken to ensure that the experiment would be carried out with the bung on a horizontal orbit. This is because otherwise the distance of radius would change. A stopwatch was used to record the time it took the rotations to complete. Human reactions would be relied upon to make the results accurate. To ensure the rotations could be counted correctly then the bung would be lined up with an object in the background so it could be clearly seen every time it passed. The results will be repeated for a greater deal of accuracy and an average of the repeat will be taken as a final reading. The range of radius we will use is: 25, 30, 30, 40, 45 and 50. The results would be written in a results table as we went along. The graph we will use to show the evidence is:
V² will be worked out with the following formula:
Variable: Radius of the Orbit
Safety
Safety goggles must be worn when carrying out the experiment to prevent the bung from hitting anybody in the eye and damaging it. In addition, the experiment must be carried out in an open space to as to prevent the bung from hitting parts of the surroundings and ruining the experiment.
Observation Section
.
Analysis
From our results, we can see a clear trend emerging. As the radius increases, the time taken for 20 rotations to be completed increases. When displayed in the graphs above the increase is almost a straight-line graph and would therefore be directly proportional to the increase in radius if the experiment were more accurate.
This means that the results support my original prediction, which was:
“I predict that as the length of wire increases the force applied upon the wire will increase, thus the longer it will take the bung to complete the amount of rotations. This is backed up by what we have recorded in the preliminary results and the background knowledge.”
Therefore, we can conclude that as the radius increased in distance so too did the time it took to complete 30 rotations for the bung, in direct proportion to the increase in distance. This is because we know that Where f = force, m = mass, v = velocity and r = radius. So if r is increased then the rest of the formula increases in direct proportion to the initial increase. Newton’s First Law states that an object travels at constant velocity unless acted on by an unbalanced force. The unbalanced force is the weight in our experiment increases which is the force making the speed increase because more force is being added. Therefore, this explains why the speed increases.
Evaluation
The experiment we used to carry out investigation proved to very inaccurate when taking results. The evidence take proved to be inaccurate when plotted on graphs. Many changes could have been made to the experiment to make it more accurate. These could have been:
- Setting up a better method of counting the rotations completed by the bung by using more advanced equipment than merely relying on human reactions.
- Increased the amount of rotations to ensure greater accuracy.
- Increased the number of repeats to get a more accurate average.
- Setting up computer equipment to take the timings for the experiment more accurately. This could be done using a motion sensor connected to a data logger to record the information.
- By doing the experiment outside uncontrollable factors such as wind can increase friction acting upon the bung and alter the time by small amounts which still make the experiment less accurate.
Due to the inaccuracy of the results the conclusion is not as sufficiently supported as most results can be considered as anomalies not allowing a strong trend to be seen but instead a weak trend. The evidence was not reliable mostly due to the reliance upon human reaction to obtain the timings for the experiment, which is too inaccurate when a great deal of accuracy is required in an experiment like this one. For Example in a time of 5 seconds the human reaction time of 0.7s can be very significant in the result as 1.4s is involved in starting and stopping the clock.
Further work that could be done to provide additional relevant evidence would be to continue the experiment past two repeats. In addition, different experiments can be done with more rotations and larger radii. With these extensions the plan would remain the same with the experiment set up in the same way. The same variables will be kept constant with only the radius of the orbit being changed.
Furthermore, we could also do further experiments to see how other factors such as varying the weight of the bung or object at the end of the fishing wire will affect the velocity of an object moving in a circle. This can be done with the same method again and controlling the same factors as well as the radius of the orbit and the only variable would be the weight at the end of the fishing wire. The experiment could be done more accurately by using more technology such as motion sensors and a data logger as stated above.