i) It prevents objects moving or slows them down;
ii) It produces heat when two objects rub against each other.
iii) It wears things out as surfaces rub together.
In our investigation we hope to reduce friction by using a dynamic trolley, however this is not 100% possible. However, friction can be reduced by the use of:
- Bearings,
- Lubrication,
- Streamlining.
Bearings and lubrication are used to reduce friction between a wheel and its axle. The ball bearings reduce the area of contact between the moving surfaces. The oil between the bearings, wheel and axle acts as a lubricant by separating the moving surfaces with a thin layer of liquid (we hope this to be the case with the wheels of our trolley.)
In order to determine what affects the movement we will have to find the speed, average speed, and in some cases the acceleration.
The formula for speed is:
Speed = distance moved / traveled
Time taken
The velocity is the trolley’s speed in a specific direction, the formula for velocity:
Velocity = Displacement
Time Taken
Quantities that have both size and direction, such as displacement and velocity, are called vectors. Quantities that have size but no direction, such as distance and speed, are called scalars. Another example of a vector is weight. The weight of an object always acts in a downward direction.
Average speed is obtained from the total distance moved and the total time taken:
Average Speed = total distance traveled
Total time taken
When a moving object increases its speed, we say it accelerates. The rate at which an object increases it speed is called the acceleration.
Acceleration = change in speed = change in speed per unit time
Time Taken
After studying Forces I have decided to investigate how the height of the ramp affect the movement of the trolley and whether mass is a variable which will affect the trolleys movement. So, my investigation is as accurate as possible my main timing device will be the ticker tape timer, I will also carry out a set of results which will be timed with a stop watch so we can see the accuracy difference. I have briefly explained below why I will be using certain equipment, before I write my method:
a) The Ticker Tape Timer
The Ticker Tape Timer is used to quantify the acceleration, velocity, or displacement of an object in motion, which is attached to the ticker timer. The alternating current source provides the necessary alternating p.d to drive the tapper for producing the dots on the ticker tape at a certain fixed frequency, e.g., 50Hz. It is an electrical device making oscillations of a steel strip to make short intervals of time. It consists of a steel strip which vibrates 50 times a second and makes 50 dots a second on a paper tape being pulled past it. Between two consecutive dots, there is a time interval of 0.02 seconds. If there are 10 spaces on a piece of tape to pass through the timer is 10 x 0.02s = 0.20s.
b) Stop Watch
One of the comparisons I will be making is the accuracy difference between a stopwatch and calculating the time taken with a Ticker Tape Timer.
The accuracies of these two instruments are as follows:
1. Stopwatch / clock: 1/10 s
2. Ticker Tape Timer: 1 / 50 s
c) Stopper
I will have to put a stopper at the end of the ramp to prevent the trolley jumping, and implementing it to go straight to the end of the ramp smoothly, therefore not affecting my results. This could be a box or any other heavy item.
d) Dynamics Trolley
This type of trolley tries to keep the force of friction to a minimum, however we will still take this margin of error into account when calculating and comparing results.
INVESTIGATING THE FACTORS WHICH AFFECT THE MOTION OF A TROLLEY DOWN A RAMP
HEIGHT VARIABLE
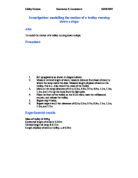
Apparatus
In the duration of the investigation, I will use the following apparatus:
- Two x 1m rulers
- A ramp
- Clamp and Stand
- Dynamics Trolley
- Ticker Tape Timer
- Ticker Tape
- Power Pack
- Stopwatch
- Stopper
Method:
To carry out this investigation we will work in groups of three or four, as this will make it less complex.
1. Collect the equipment as shown in the apparatus list above.
2. Set the ramp at an incline carefully adjusted to the correct height so that no force will change the speed of the trolley.
The heights I will use are:
10cm, 20cm, 30cm, 40cm, 50cm and if time permits we may try 50cm plus if it is safe.
To make this investigation successful, we must choose a sensible range, and amount, of readings to record in order to come up with a useful and informative outcome. For example, in the experiment it would be pointless to experiment with heights ranging from 1cm-2cm because the speed difference would be minor. Instead, a more sensible range, so I have chosen from 10cm-50cm, would be appropriate and should yield some interesting results. We could take readings every 10cm, and take a minimum of three readings (only when using a stop watch, use one reading when using a ticker tape timer) on each height to work out an average (this makes the end result more accurate).
3. Using the clamp and stand, clamp the ramp securely at each height.
4. Plug the power pack in, attach Ticker Tape Timer, and stick the trolley to one end of the Ticker Tape making sure that the trolley can freely move.
Diagram of Apparatus
5. Once the apparatus is set up like this, we will switch the Ticker Tape Timer on and release the trolley so that it can accelerate down the ramp. I will measure its speed from the very point it starts for two metres. I chose two metres as a suitable distance, so the trolley has an opportunity to reach its maximum speed and average speed. I will do each height three times so I can get an average to ensure accuracy. I can then plot a rough graph and check if any results are anomalous and need repeating, rather than having to make an assumption as to which results are erroneous in the table.
6. Once the investigation has been carried out and all the results have been done I will work out the average speed by using the formula:
AVERAGE SPEED = DISTANCE / TIME
Safety
There are no real safety issues to worry about, however to be certain that there are no injuries, we will make sure everyone’s ramps are well spaced apart, to prevent any trolleys colliding into anyone, and that our ramp is very stable to prevent it collapsing and hurting someone.
Fair Testing
It is important to keep the factors of this experiment fair and by doing this I will have only one independent variable element which will be ‘height of the ramp’. The components I will keep consistent throughout will be:
1. Mass of Trolley: As the force, which will be, acting on the ramp must stay the same throughout, and the mass is what will determine this. To control this quandary we will use the same trolley each time, however I will be doing some research into whether or not the mass affects this.
2. Friction will slow down the speed at which the trolley travels. A way of reducing the friction is by having a smooth surface and keeping the superficies of the wheels the same.
3. Air Resistance: We cannot control this largely however we aim to keep the aerodynamics of the trolley the same each time.
4. The length of the ramp must remain the same otherwise we will not be able to know whether the acceleration was influenced by the height of the ramp or another factor and if the ramp length was to be extended further this would cause there to be a different velocity.
Prediction
I predict that the higher the ramp the faster the speed of the trolley will be, the average velocity and time will not be directly proportional.
Due to gravitational potential energy (GPE_ that is the amount of energy that an object has at its resting position. The trolley at the top of the ramp has more GPE, than when it comes of the ramp.
GPE = mass x g x height
Where g = acceleration due to gravity
= 10m/s squared
However, when the object begins to fall its GPE is gradually converted into kinetic energy (KE)
KE = ½ x mass x velocity squared
Therefore, at the top of the ramp, the GPE is at its maximum and at the bottom of the ramp, the KE is at its maximum, this is because the energy is being converted as it cannot be destroyed. Moreover, I can therefore presume that as the height of the ramp is increased the velocity of the trolley will also increase. However as correct as my predicted results are my actual results will not be exactly like these due to friction. They may be quite similar to the results I get when the ramp is set at a low incline as the alacrity will be slower meaning less friction will be acting on the trolley. However, as the height is raised the trolleys velocity increases and the friction will exert a stronger force on the object and will act as a resistance slowing the trolley down causing some of the energy, which I have predicted to be "lost.”
This is all assuming that there is a 100% energy conversion where:
POTENTIAL ENERGY KINETIC ENERGY.
This naturally not possible because as I earlier explained that even though the dynamics trolley is designed to be frictionless, this equipment is old therefore friction may occur.
.m x g x h = ½ mv squared.
.m x g x h = ½ mv squared.
m m
g x h = v squared.
2
2g x h = v squared.
V = √ 2 x g x h
V = √ 2 g h
INVESTIGATING THE FACTORS WHICH AFFECT THE MOTION OF A TROLLEY DOWN A RAMP
MASS VARIABLE
Apparatus
In the duration of the investigation, I will use the following apparatus:
- Two x 1m rulers
- A ramp
- Clamp and Stand
- Ticker Tape Timer
- Ticker Tape
- Power Pack
- Stop Watch
- Stopper
Method:
To carry out this investigation we will work in groups of three or four, as this will make it less complex.
1. Collect the equipment as shown in the apparatus list above.
2. Attach a weight to the trolley:
The weights I will use are: 10g, 20g, 30g, 40g, 50g, and we will try to use 50g+ if it is safe.
3. Set the ramp at an incline carefully adjusted to the correct height so that no force will change the speed of the trolley, this will be a controlled variable.
The fixed height I will use is: 30cm
To make this investigation successful, we must choose a sensible range, and amount, of readings to record in order to come up with a useful and informative outcome. For example, in the experiment it would be pointless to experiment with weights ranging from 1g – 2g because this would not allow us to see whether there is a significant change. Instead, a more sensible range, so I have chosen from 10g – 50g, would be appropriate and should yield some interesting results. We could take readings every 10g, and take a minimum of three readings (when using a stop clock and only one with ticker tape timer) on each height to work out an average (this makes the end result more accurate).
4. Using the clamp and stand, clamp the ramp securely at fixed height
5. Plug the power pack in, attach Ticker Tape Timer, and stick the trolley to one end of the Ticker Tape making sure that the trolley can freely move.
6. Once the apparatus is set up like this, we will switch the Ticker Tape Timer on and release the trolley so that it can accelerate down the ramp. I will measure its speed from the very point it starts for two metres. I chose two metres as a suitable distance, so the trolley has an opportunity to reach its maximum speed and average speed. I will do each height three times so I can get an average to ensure accuracy. I can then plot a rough graph and check if any results are anomalous and need repeating, rather than having to make an assumption as to which results are erroneous in the table.
Diagram of Apparatus
Safety
There are no real safety issues to worry about, however to be certain that there are no injuries, we will make sure everyone’s ramps are well spaced apart, to prevent any trolleys colliding into anyone, and that our ramp is very stable to prevent it collapsing and hurting someone.
Fair Testing
It is important to keep the factors of this experiment fair and by doing this I will have only one independent variable element which will be ‘mass of trolley’. The components I will keep consistent throughout will be:
1. Height of Ramp: As we are investigating if the mass of the trolley we must not increase or decrease the height, that would not give us accurate results.
2. Friction will slow down the speed at which the trolley travels. A way of reducing the friction is by having a smooth surface and keeping the superficies of the wheels the same.
3. Air Resistance: We cannot control this largely however we aim to keep the aerodynamics of the trolley the same each time.
4. The length of the ramp must remain the same otherwise we will not be able to know whether the acceleration was influenced by the height of the ramp or another factor and if the ramp length was to be extended further this would cause there to be a different velocity.
Prediction:
I predict that there will be no change in the speed that the trolley travels down the ramp at each different added mass variable. However, I feel that there will a be a degree of inaccuracy in the results because the ramp are not in perfect condition and they trolleys likewise are not frictionless.
Obtaining Evidence
HEIGHT VARIABLE
10 cm
Acceleration:
A = Change in Velocity
Time Taken
A = v – u (final bar speed)
T (number of bars x 0.2)
A = 13.8 = 62.73 cm / sec squared
2.2
Therefore acceleration for height 10cm = 62.73 cm / sec squared
20 cm
Acceleration:
A = Change in Velocity
Time Taken
A = v – u (final bar speed)
T (number of bars x 0.2)
A = 150.5 = 57.884615 cm / sec squared
2.6
Therefore acceleration for height 20cm = 57.884615 cm / sec squared
30 cm
Acceleration:
A = Change in Velocity
Time Taken
A = v – u (final bar speed)
T (number of bars x 0.2)
A = 194.5 = 97.25 cm / sec squared
2
Therefore acceleration for height 30cm = 97.25 cm / sec squared
40 cm
Acceleration:
A = Change in Velocity
Time Taken
A = v – u (final bar speed)
T (number of bars x 0.2)
A = 207.5 = 129.6875 cm / sec squared
1.6
Therefore acceleration for height 40cm = 129.6875 cm / sec squared
50 cm
Acceleration:
A = Change in Velocity
Time Taken
A = v – u (final bar speed)
T (number of bars x 0.2)
A = 221.5 = 159.214 cm / sec squared
1.4
Therefore acceleration for height 50cm = 158.214 cm / sec squared
Acceleration of Trolley at five Different Heights
Obtaining Evidence
MASS VARIABLE
Fixed Height: 30cm
Added Mass: 100g
Acceleration:
A = Change in Velocity
Time Taken
A = v – u (final bar speed)
T (number of bars x 0.2)
A = 138 = 62.727 cm / sec squared
2.2
Therefore acceleration for added mass 100g = 62.727 cm / sec squared
Fixed Height: 30cm
Added Mass: 200g
Acceleration:
A = Change in Velocity
Time Taken
A = v – u (final bar speed)
T (number of bars x 0.2)
A = 141 = 64.09 cm / sec squared
2.2
Therefore acceleration for added mass 200g = 64.09 cm / sec squared
Fixed Height: 30cm
Added Mass: 300g
Acceleration:
A = Change in Velocity
Time Taken
A = v – u (final bar speed)
T (number of bars x 0.2)
A = 138 = 62.727 cm / sec squared
2.2
Therefore acceleration for added mass 300g = 62.727 cm / sec squared
Fixed Height: 30cm
Added Mass: 400g
Acceleration:
A = Change in Velocity
Time Taken
A = v – u (final bar speed)
T (number of bars x 0.2)
A = 137.5 = 62.5 cm / sec squared
2.2
Therefore acceleration for added mass 400g = 62.5 cm / sec squared
Fixed Height: 30cm
Added Mass: 500g
Acceleration:
A = Change in Velocity
Time Taken
A = v – u (final bar speed)
T (number of bars x 0.2)
A = 142.5 = 64.77 cm / sec squared
2.2
Therefore acceleration for added mass 500g = 64.77 cm / sec squared
Acceleration of Trolley for 5 Different Added Masses
AVERAGE SPEED RESULTS.
Before using the Ticker Tape Timer I carried out some results on different height with a stop watch, the results are shown below. THESE RESULTS WERE OBTAINED BY USING ONLY A STOP WATCH.
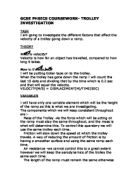
PHYSICS
SCIENCE COURSEWORK
Ticker Tape Time
INVESTIGATION
Investigating the Factors Which Affect the Motion of a Trolley Down an Inclined Plane
Imandeep Bansal 11MB
Height of Ramp Variable
Looking at my graph in obtaining evidence I am able to make a conclusion, which proves my prediction correct. That the greater the height, the faster the velocity. However, as the height doubles the velocity does not.
For example, when the height was 10cm the average speed was 62.73cm/second, yet when the ramp was set at an incline of 20cm the velocity was 0.72
My results display that the higher the ramp the faster the velocity of the trolley will be. This is because an object, which is a certain distance above the ground, has gravitational potential energy (GPE), and when the trolley rolls down the ramp, this energy is converted gradually into Kinetic Energy (KE). By the time, the trolley reaches the end of the ramp all the GPE will have converted to KE.
In contrast with my prediction, I think I have been correct by what I said. I predicted that my average speed would be slightly less than the results I plotted on the table due to the friction acting on the trolley, especially when the ramp was suspended at 0.5m. In addition, that my results would not be as far spread out as the height increased and my graph proves this as it does evens out at the end.
Added Mass Variable
Investigating this variable was to ensure that my mathematical equations were right, that mass should make no difference (or little difference, depending on equipment) to the rate at which a trolley travels an inclined plane, the evidence supports my prediction.
This is because