I could get results for this experiments by recording a number of
things, I could record:
The effect of temperature.
The amount of gas produced by the reaction in a certain amount of time
The mass lost during the reaction.
I am going to record the amount of time it takes for the calcium carbonate to dissolve I will time this until the reaction is finished when the mixture is no longer cloudy. This is a neutralization reaction so when the mixture turns clear this means the base has neutralized the acid I predict that the higher the concentration of acid the faster the rate of reaction will be. I think this will happen because the more acid there is the ions present in the reaction will have more kinetic energy so they move through the solution faster so the ions will collide more often and more vigorously meaning there is a greater chance they will react.
Method
plug in scales
test all equipment for accuracy
pour HCL into a beaker
use a separate beaker of the same size and fill with water
get 2 measuring cylinders of the same size and measure the amount of HCL that will be tested in each experiment.
measure 0.1g of calcium carbonate
place mat with a cross under the conical flask
pour contents of HCL and make sure the whole measurement is put in the conical flask
pour mass of calcium carbonate into conical flask
immediately start the stop watch
observe how long it takes for the calcium carbonate to dissolve
wash conical flask for accuracy
repeat the following steps a further 2 times for each concentration to be able to calculate the average for each concentration
Safety Measures taken
belongings out of the way
wearing goggles
long hair tied back
Conclusion
The higher the concentration the faster the reaction between the hydrochloric acid and calcium carbonate because the collision rate would be higher for example my results show when we double the concentration from 7.3 40% to 14.6g/dm3 20% the number of molecules initially doubles as well which shows by increasing the concentration the higher the rate of reaction because the number of collisions per second increased. Throughout my experiment I also found that by increasing the concentration the more energy the particles had this is observed through the amount of time it takes for the reactants to collide for example when the concentration is 36g/dm3 the average time taken for calcium carbonate to react with hydrochloric acid is 27seconds whereas when there is less concentration the longer it takes for the particles to react because there is less energy. in my investigation using this particular method of timing how long it took for the solid to disappear was effective because we couldn't time how long it takes for the cross to disappear because as the reaction went on the reactants were not becoming cloudy the reactants return the solution to clear.
Explanation
In my experiment the aim was to investigate the rate of reaction by increasing the concentration we were able to identify the effect of that the concentration had on the calcium carbonate when the reaction took place my conclusion was able to support my graph and my prediction because it was based on the scientific idea of the collision theory which is the theory that suggests that there has to be an activation energy in order for the rate of reaction to be successful the more active the reactants are the higher the number of collisions double.
Evaluation -
I believe my experiment went well because the all the variables that were supposed to be controlled throughout the investigation were maintained for example by sticking to the method this increases the reliability of my results and the confidence in my conclusion. In my experiment I used the same sizes of equipment and the integers of all the equipment that uses any liquid or aq solutions were adjusted to the amount of reactants used for example making sure the volume of reactants in the flask were 25.0cm3 at all times. and the conical flask I used specifically had bold integers which allowed me to see clearly and avoid making mistakes. I also believe my experiment was successful because I was able to repeat the experiment and do a practise without recording the results to check the reliability of the equipment. My results had no outliers and there is a clear pattern of behaviour by looking at my graph I am able to determine the close relationship between the results because the ranges are not far apart which suggests the results are accurate. my method was very clear and straight forward and the experment was simple which made the steps easier to follow. The experiment gave an idea of how much impact the different concentrations had on the time taken for the calcium carbornate solid to dissapear. but using this specific experiment doesn't allow me to get a detailed insight into the effect of the rate of reaction because we only observe how long it takes for the solid to dissolve which means because it reacts very quickly we cannot analyse the rate of reaction closely whereas investigating a different variable that affects the rate of reaction for example gas. to improve my experiment I will measure the gas produced but keep time as the dependent variable and the independent variable will remain the same because I will still be investigating the effect that the concentration has on the rate of reaction but recording the amount of gas produced will allow me to calculate the rate of reaction and by comparing the different concentrations using this method is also more effective because in this experiment I was not able to control room temperature but by using a gas burette stand and clamp no air will be able to get into the conical flask this by using two different methods this will also allow me to compare the effectiveness and assess the reliability ultimately increasing my knowledge and confidence in my conclusion. I am confident that my conclusion is reliable to a respectable extent but in order for me to strongly agree with my experiment I need to be able to take a variety of readings also instead of timing the reaction until its finished when I use this method I will be able to record more results and more frequently by recording the amount of gas produced every 10seconds,The actual experiment focuses on how dilute the acid is and how quickly the product is formed. This is more effective because it is more accurate. Another thing I can improve in my next experiment is increasing the amount of solid I use because this could've affected my conclusion and the time taken for it to be neutralized increasing the solid also allows me to clearly see the reaction occuring using 0.1g of calcium carbonate was a small mass and the reaction happened very quickly so to be able to improve my experiment I will have the chance to look at the reaction happen at a rate where I can see more changes and closely tell what is happening throughout the reaction. it also and compare the results with another set of results from other . Overall I think that the evidence I got was quite reliable and was as reliable as it could be in the amount of time given.doing the same experiment. In this experiment each person was specifically assigned to carry out a part of the procedure so having different people do different things could affect the result for example someone else could stirr the remaining solid and can make the solid disappear more quicker than it should or more importantly a part of the method could be carried out incorectly. at the moment I am satisfied with my preliminary experiment because the data seems to be reliable and I was able to point out any factors that could be changed by evaluating the procedures.
Actual Experiment
For my Actual improved experiment there were two methods I could've used for an improved experiment to be able to effectively compare it against my preliminary experiment we tried two different experiments with two different variables
Experiment 1
For this experiment the independent variable was to find out the amount of mass lost during the reaction between Calcium Carbonate and hydrochloric acid every 10 seconds we recorded the mass of the reaction I predicted the mass would decrease every 10 seconds. Although the process of the experiment is efficient and more simple we found that this variable was not an accurate experiment and we did not have enough control over many of the variables to keep it a fair test and the results we ended up with were not in any particular pattern which tells me that the data wasn’t reliable enough to analyze further I decided to use the Gas syringe method instead.
Experiment 2
This is the Gas syringe experiment which allowed me to measure the amount of gas produced during the experiment this was effective because it allowed me to have a closer analysis on the effect the gas specifically had on the rate of reaction by being able to see what happens during the experiment by specifically recording the changes and how long the experiment lasted for.
Equipment List
Gas Syringe - This is the main part of the experiment the equipment that the experiment is dependent on it is a scale of how much gas is present during the experiment. The gas syringe has an accuracy of 1 and each large integer marked goes up in 10s the full capacity of the gas syringe is 100dm3.
Conical Flask - the gas syringe had to be able to be a perfect fit into the conical flask because the idea is to trap the contents of all the reactants to be able to get an accurate reading and find the amount of gas produced. we tried different conical flask and chose one that measures to the nearest 10 with integers in between of 5.
Beaker - this holds the contents of the hydrochloric acid and water temporarily until the measuring cylinder is used because it ensures safety instead of pouring the hydrochloric acid from the glass bottle which was quite heavy and difficult to handle the beaker allowed me to clearly see the amount I was using. and to keep it a fair test we used a separate beaker for the water. we could have used any sized beaker as we continuously used it for the number of experiments we were doing but to keep it a fair test we decided to use 2 of the same size for both the water and hydrochloric acid which had integers of 5 and the maximum contents was 250ml
2 Measuring cylinders - the measuring cylinders are an accurate measurement of how much water and hydrochloric acid we were using and was quite large with close integers which was clearer for us to see to identify the measuring cylinder with the water and the other with the hydrochloric acid we chose different colored ones one white and one cream to avoid confusion and to ensure accuracy. We had a choice between measuring cylinders that measure to the nearest 5 , 10 and 20. like the beakers the measuring cylinders we used were exactly the same size and had a difference of 5ml between each integer but went up the larger integers going up In 20's which was the best one for us to use because it was convenient for each concentration we were testing.
Stop Watch - This times how long the experiment takes and is the dependent variable. it measures to the nearest millisecond but the minutes and seconds taken are all visible as well throughout the experiment.
Watch Glass and Spatula - the watch glass keeps the calcium carbonate we used together because we wanted to be able to use all traces of the calcium carbonate we measured on the scales. the spatula avoids making a mess and to pick up small amounts of the calcium carbonate to be able to efficiently measure it on the scales.
Electrical scales - this measures the mass of calcium carbonate which measures to the nearest gram.
Stand and clamp - This makes supports the gas syringe by making it stable makes it level so we can clearly record the readings of the amount of gas produced the stand and clamp had a clutch and clasp which allowed me to adjust the stand and clamp so I could move it the way I wanted to.
Pen and Paper with temporary results table - to record all results while the experiment goes on and then to be later edited by creating a final one which would display the results that will be plotted on the graphs.
Method
Experiment 1
Firstly measure our all of the reactants
Put the conical flask on top of the scales and press zero to make sure that the scales only measure the reactants inside and not the conical flask.
Then add in the calcium carbonate and immediately add the hydrochloric acid
Start the stop watch.
Take a reading that is displayed on the scales every 10 seconds the mass should decrease therefore when all the results are recorded allowing us to measure the complete amount of gas loss.
Experiment 2
set out all equipment on the table
measure the volume of reactants
use the measuring cylinder and pour the hydrochloric acid and water into the conical flask
make sure the gas syringe works and the stand and clamp are successfully supporting the gas syringe
make sure the cork is ready to use and that it fits correctly into the conical flask
add the calcium carbonate check to see that it hasn't spilt as this could have an effect on the accuracy and reliability of the results.
immediately use the cork to secure the volume of reactants in the flask
and make sure the stop watch has been started.
check the gas syringe is at 0 before the experiment has been started.
observe the gas syringe and take a reading every 10seconds the gas produced should constantly increase and should come to a stop where the volume of gas produced stays at the same number when the reaction finishes.
repeat steps and make sure a practice run through has been done.
(Enforce safety measures before beginning of experiment refer to preliminary work for detailed steps taken to ensure investigation was carried out safely)
Fair test
It was important for me to keep a fair test in my actual experiment because I now had the experience of carrying out a preliminary experiment which allowed me to improve the chances of making sure the variables I could control were made as fair as possible to increase the reliability in my results further. In the gas syringe experiment it was important for me to be as observant as possible because their were many key things to make as precise as possible so we decided to work as a group of 6 we split the tasks and 3 pairs each pair was assigned to carry out the experiment with a different concentration to make sure it was as efficient and fair as possible. The independent variable was kept the same with both the preliminary and the actual experiment so we are able to make a direct comparison between the effect the different concentrations had on the rate of reaction. by doing research we are able to determine that there are many variables that affect the rate of reaction in our preliminary experiment we didn’t focus on the things that can affect the rate of reaction we timed the reaction until it was finished but in our actual experiment the gas pressure determines how quick the reaction took place and the dependant variable was always time but instead of measuring the reaction until it finished we timed it throughout we found that 10 was a suitable number and recorded the volume of gas produced every 10seconds in our preliminary experiment we decided we should improve the experiment by adding a larger amount of calcium carbonate because the ratio of hydrochloric acid and water was too much so increasing the the calcium carbonate. We changed our calcium carbonate size because 0.1 was too small and we couldn’t observe the reaction to the best ability as we could have liked to, therefore we times it by 10 but then that took way to long. So finally we came to an agreement that doubled everything by 4 so we got 0.4grams instead. when we did a practise experiment. we also washed the conical flasks after every experiment and used 3 conical flasks because we needed to test each concentration 3 times. we kept the scales of the equipment to numbers that are easier to work for example the gas syringe had an accuracy of 100ml integers of 10dm3 the concentration of acid and water were multiples of 20 the measuring cylinders also had marked integers of 20 as well which made it easier to control the variables and consistently produce accurate results.
Conclusion
Variable that affected the rate of reaction
Increasing/decreasing gas pressure.
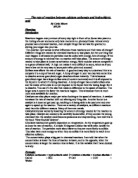
In my experiment we tested five different percentages of concentration: water
1- 100cm/3 Hydrochloric acid
2 - 20cm/3 hydrochloric acid 20ml Water
3 - 60cm/3 hydrochloric acid 40ml Water
4 - 40cm/3 Hydrochloric acid 60ml water
5 - 20cm/3 Hydrochloric acid 80ml Water
The fastest reaction was the first experiment it is the shortest curve on the graph and the range bars are the closest here. the slowest reaction was experiment five because there was more water and it took a longer time for the experiment to finish for the first 50 seconds the calcium carbonate and hydrochloric acid reacted quickly and more evidently whereas afterwards there was still solid that appeared at the bottom of the solution taking an overall time of 340 seconds to end. Not only can we tell the rate of reaction by observing the time taken for the whole reaction to be neutralized but I can also compare the time taken for the reaction to finish the difference between the intial rates and by comparing the highest amount of gas produced and the lowest. In my graph experiment number 3 and 4 have curves and ranges that meet and overlap because the results were so similar which made the initial rates of both curves have the closest difference. experiment numbers 1 and 2 are very close as well but the difference in the pattern of results on the graph can be recognized. graph number 1 the curves are shown all meeting and continuing this represents all the experiments reacting then ending with the volume of gas produced becoming constant because there is no pattern of the results decreasing. In the graph of the first 50 seconds this is the clearest graph and has a strong linear pattern tis can be described by calculating the gradient y = dx/dy My graph supported my prediction which was the higher the concentration of hydrochloric acid the higher the amount of gas produced. by looking at my graph there is a positive correlation I produced 3 graphs the first graph allowed me to clearly see the pattern of each concentration and the effect if had on the rate of reaction the first graph the variable on the x axis was time and the y axis variable was the volume of gas produced this showed the whole reaction I found that within the first 50 seconds the reaction was most clear and this is where the calcium carbonate and concentration was most reactive so during this time in the reaction the volume of gas produced was highest so I drew a graph of the first 50 seconds and calculated the gradient for each curve. there were 5 curves which represented the 5 different concentrations I calculated the gradient on this graph because to plot the second graph which was the initial rate against the concentration this would allow me to find the exact rate of reaction for each concentration. the initial rate(gradient) is the speed of the whole reaction and this is why I believe the graphs support my prediction.
Calculations
Calcium Carbonate + Hydrochloric Acid ---> Calcium Chloride + Water + Carbon dioxide.
CaCo3 (s) + 2HCL(aq) ---> CaCl2(aq) + H20(l) + CO2(g)
Salt produced - Calcium carbonate
Acid used to neutralize the reaction - Hydrochloric acid
This equation tells me the reactants needed and the products produced but doesn't explain how much is needed to for an accurate reaction to take place. and how much is needed so the gas produce is able to be recorded the equation also doesn't tell us how much product you would get if a certain amount of reactant is used.
Calculating the Yield
2HCL(aq) + CaCO3(s) ---> CaCl2(aq) + H20 (l) + CO2(g)
37g 100g 110g 18g 44g
Because the equation has been balanced I will require two HCL which means doubling the amount 37 x 2 = 74g 74gr reacts with 100gr to produce 110gr and 18gr and 44gr which is then halved to use in my experiment because the total is too large and cannot be used for my investigation 37gr of HCL will react with 50gr of CaCO3 to produce 55gr of CaCl2 and 9gr of H2O and 22gr of CO2
To work out the mass :
1000 cm3 contains 36.5gr of Hydrochloric acid
1gram =
1000 x 36.5 = 0.0365
we are able to tell that :
1cm3 = 0.0365
The smallest amount of Hydrochloric acid used in this experiment was
20ml so
to calculate the amount of calcium carbonate = 0.0365 x 20 = 0.73g
but because this is too big we found that using 0.4 would be the best option.
Explaining Conclusion
The rate of reaction between calcium carbonate and hydrochloric acid increases when you increase the concentration of acid the graph shows each curve get steeper to confirm my prediction I calculated the rate of reaction from my graph I did this by taking two points on the graph and drawing a line down on the highest point (line a) and across on the lowest point (line b) and drawing until they join and make a triangle I then divided the length. The gradient is how many squares the line goes up for every square it goes across. As you can see the gradient is higher for the higher the concentration of acid. The reason why this happens is because at a higher temperature ions have more kinetic energy so they move through the solution faster so the ions will collide more often and more vigorously so there is a greater chance of a reaction happening as reactions happen when ions collide. All my lines of best fit go through the origin as after no time no reaction has happened. All of my lines of best fit are more or less directly proportional so when you double the amount of time the amount of gas released also doubles. This is because at double the heat the ions move double as fast so are twice as likely to have collisions. on my second graph that shows the rate of reaction it would be a steady curve increasing with the concentration and as you can see it is.
Evaluation of procedures
. I believe my method was reliable because not only did we repeat the experiment but we did more than one practice experiments to find which amounts of each reactant to use and because we used different pairs to specifically focus on carrying out the experiment with one concentration each we were able to stick to being accurate and keeping it a fair test. which means we could maintain the variables better. I believe the equipment I used was very accurate and reliable this is why we chose to carry out the gas syringe experiment because we found out by measuring the amount of gas lost the scales and equipment wasn’t suited well enough to make the investigation an overall success. but I believe recording the changes in volume of gas produced every 10seconds wasn't always the best scale factor because at the beginning there was quite a lot of movement in the ranges of results we got and I believe by recording the results every 5 seconds would've given me a clearer average to use for my graphs. one of the things about the experiment is that we weren't very familiar with the procedure of using the gas syringe so sometimes it was difficult to determine whether we were doing the experiment correctly and to truly know whether all the equipment used was reliable enough I also think it affected our judgments of the equipment accuracy and which equipment was best suited for the experiment.
Reliability of evidence
I think that the method I used got me accurate and reliable results as you can see by the fact that they matched my prediction think my results were accurate because I carried out my experiment with care repeating the experiment twice and measuring out my substances carefully and accurately. We had a minimal amount of outliers and we were able to successfully find out the problem with the experiment that caused the outliers the difference between repeats of the experiment compared to a difference below 5 for all average readings which also adds to the reliability of the evidence all the graphs drawn had a similar pattern and by looking at all 3 graphs I am able to spot a correlation between the results. but I also feel that because there was a scale of 0.5 for the graph that it was difficult to plot the graphs and using such a small number made it difficult to tell where exactly each point is on the graphs. which could've caused percentage errors and the difference between the error bars could've been difficult to spot. I feel that we should've peer reviewed the evidence with a wider range of people not just students in the class because this would have been able to support my judgment of the reliability further.
Reliability of Conclusion
I feel that if someone else was to carry out the experiment that I did using my method they would get similar results but not completely the same because the variables that we aren't able to control such as room temperature and the reactants they use wouldn't come from the same source for example the hydrochloric acid we used there were 3 bottles we couldve used but we stuck with the same one since they all had different concentrations mixed with water which means it could have an impact on the reliability of the results and conclusion. I am fairly confident in my conclusion but I have learnt by carrying out this experiment that you cant expect to get exactly the same results each time you carry it out. Another reason why if someone carried out the same experiment using our method they wouldn't get the same results because they wouldn’t be able to calculate an average if we have to repeat the experiment three times and not get the exact same result each time then someone else wouldn't either. I always feel that there is room for improvement if the experiment is repeated so I cannot completely agree with the reliability of my conclusion 100% and there were too many things I was unsure of when assessing the results I ended up with. If someone was to repeat the experiment I do believe they would end up with a similar if not the same trend because when compared even without the exact same amount of reactants used a similar trend and pattern seemed evident. Overall My procedures and Reliability of my evidence make me feel both strongly confident in my conclusion and not so confident in my conclusion because to make a specific judgement all of the factors in the experiment have to be considered.