I shall not be using a catalyst.
Prediction
I predict that as the concentration of the sodium thiosulphate increases the rate of reaction will increase. This means that both graphs drawn up in my analysis will have positive correlation, and will probably be curved as the increase in rate of reaction will not be exactly the same as the concentration increased.
Volume of sodium thiosulphate (cm³)
This shows that concentration is inversely proportional to time. Whilst also showing, in accordance with my prediction, that the higher the concentration, the lower the reaction time.
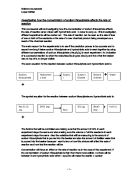
This can be justified by relating to the collision theory. When the concentration is increased the total number of particles in the substance will have amplified, therefore colliding more often. However, when collisions occur, they do not always result in a reaction. Only if the two colliding molecules have sufficient energy to overcome the activation barrier will they react. This is the kinetic theory. It is normally applied to temperature, i.e., increasing temperature means the molecules move faster, but it is also relevant here. So, we can deduce from this that the temperature will also affect the experiment and therefore must remain constant.All this can be understood better with full understanding of the collision theory itself:
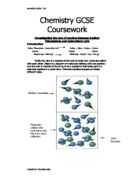
The following diagram illustrates this theory with the reaction between magnesium and hydrochloric acid, whereas we are using sodium thiosulphate instead of magnesium, but the theory is clearer if we use a solid as one of the reactants.
It is also worth noting the following:
For a chemical reaction to take place, some bonds in the reactants must be broken. The colliding particles must have enough energy to break these bonds. The minimum energy that a particle must have to overcome the barrier is called the activation energy, or Ea. The size of this activation energy is different for different reactions. Only the very fastest moving particles have enough energy to break bonds.
Prelimary Method
Before running through the actual experiment, I felt a trial run was nesscessery to ascertain the best method for gaining the most accurate and time efficient results.
In the trial run, I plan to make two observations at either end of the concentrations chosen. These will be 10cm³and 5cm³ of sodium thiosulphate. I gained the following results:
The temperature on the day of gaining these results was 21ºC.
Although we were uncertain, these results did not seem to abnormal. So we made the discision to use a similar method in gaining these results in the real experiment, which is detailed in the ‘Method’ section.
Safety
Goggles must be worn to protect the eyes.
One must be aware of the dangers that the chemicals in use present: -
- Hydrochloric acid is corrosive - any spills must be thoroughly washed immediately.
- Sodium Thiosulphate is harmful - hands must be washed after use.
Be careful when handling test tubes - they are long, thin and fragile, and are easily broken if mishandled. Any breakages must be reported immediately.
Fair Test
In order for my findings to be valid the experiment must be a fair one. I will use the same standard each time for judging when the cross has disappeared. I will make sure that the measuring cylinders for the hydrochloric acid and sodium thiosulphate will not be mixed up. The amount of hydrochloric acid will be fixed at 10 cm³ each time, and the amount of sodium thiosulphate will be varied from 5 -10 cm³. All apparatus will be washed in cold water to ensure that they are not subjected to additional heat throughout the experiment.
Method
The following appartus will be used in my investigation:
- A 10cm³ measuring cylinder which measures to 0.1cm³.
- A conical flask.
- A laminated cross.
- A small beaker.
- 6 test tubes of appropiate size.
- A stop clock.
- A thermometer.
- 2 bulbpepettes, which both measure to ±0.1cm³.
- thermometer.
- Hydrochloric acid of original concentration 1mol/dm³.
- Sodium thiosulphate of original concentration 20g/dm³.
- 1 pair of goggles.
I plan to use the following method:
1) I will firstly measure out 10cm³/0.1M sodium thiosulphate using the burette and a funnel into a conical flask.
2) I will then add 50cm³ of water to the sodium thiosulphate from a second bulbpepette to vary the concentrations. This amount of water will decrease by 10cm³ for each following experiment. For the final experiment water shall not be added.
3) Next I will measure out 10cm³ of hydrochloric acid into a small measuring cylinder.
4) Then I will tape the diagram of the laminated cross to the back of each test tube containing the sodium thiosulphate.
5) My partner will then pour in the hydrochloric acid whilst I activate the stop clock.
6) I will watch the solution to see when the cross is no longer visible, and deactivate the stop clock.
7) When the reaction is complete, the results must be recorded in a table.
8) Whilst I am observing, my partner will prepare the other water and sodium thiosulphate solutions so as to be as time efficient as possible.
At the beginning of each experiment a short check on room temperature shall be carried out and any changes noted. I will then repeat the each point three times for each concentration of sodium thiosulphate to ensure accuracy, using the same amount of hydrochloric acid. Any anomalous results will be repeated. I will then take the average of each set of three results to plot on a graph. Repeat results and averages will be taken to improve the credibility of the findings, and present solid grounding for the final conclusion. The repeat results will help to iron out any anomalies and the average will give a good summary of the results of the experiment. However if one set of results is entirely different to the other, a third experiment will be performed to replace the anomalous set of results.
Observation
Results
A fourth experiment was carried out on the 70% concentration as test 1 was deemed anomalous in comparison with the other 2 results.
I followed my plan exactly, and only encountered one dilemma
Analysis
The following graph shows the results I received from my investigation:-
Conclusion
Using my graph, I can draw a conclusion from my experiment. My graph shows negative correlation, this shows as I increased the concentration of the sodium thiosulphate the rate of reaction increased rapidly at first and then leveled off. This is most apparent in the concentrations of 10, 20 and 30%. The increase from 10 to 20%, 109.13 to 56.87 seconds, shows an almost halving in reaction rate. The doubled concentration, from 20 to 40%, fits this pattern perfectly, as it shows an almost exact halving in reaction time. This pattern of results almost entirely agrees with my predicted graph, which shows a rapid increase of reaction rate, later becoming a smaller variance in reaction times. For this to be fully comprehended it is necessary to recap the collision theory briefly:
For a reaction to occur particles have to collide with each other. Only a small percent result in a reaction. This is due to the energy barrier to overcome. Only particles with enough energy to overcome the barrier will react after colliding. The minimum energy that a particle must have to overcome the barrier is called the activation energy, or Ea. The size of this activation energy is different for different reactions. If the frequency of collisions is increased the rate of reaction will increase. However the percent of successful collisions remains the same. For example, say 30% of particles in a high concentration of sodium thiosulphate had sufficient energy to react. That 30% is more than the 30% of particles in a lower concentration of sodium thiosulphate that has enough energy to react, as there are less particles in a lower concentration than in a higher concentration. Or, to put it another way, say 20% of particles had sufficient energy to break bonds, in any concentration of sodium thiosulphate. That 20% in a higher concentration of sodium thiosulphate would be made up of more particles than 20% of particles in a lower concentration of sodium thiosulphate, as in a lower concentration there were fewer particles to begin with. An increase in the frequency of collisions can be achieved by increasing the concentration, pressure, or surface area.
The aforementioned evidence proves that my prediction was indeed correct, and the investigation itself has proved the theories stated there.
Evaluation
Improvements
The biggest factor which affected my experiment was the constant discrepancy in temperature. It was virtually impossible to control since the weather was frequently changing, and also the vast amount of students performing the same experiment in the room could have contributed to the excessive heat which could have been avoided. This could be remedied by using some sort of thermos control, for example; a water bath. The temperature of a body of water can be kept constant, and easily checked. This would not only compensate for the changes in weather, and therefore temperature, it would also allow the possibility of any differences in the strength of hydrochloric acid and also sodium thiosulphate solutions that have been prepared for us to be declared irrelevant. The concentrations of these chemicals could differ slightly according to which batch they originated from, and this could affect the rate of the reaction.
The accuracy could also have been improved, especially in the size of the test tubes used. If wider containers were used the amount of solution would be spread thinner, thus increasing the amount of preciptate needed to be formed for the cross to be hidden. Another improvement in accuracy would be a more effective way of judging when the cross is no longer visible. This could be done with the use of light sensors and a data logger attached to a computer. This would give more accurate results than the human eye it would replace. It would act not only as an eye, but also a stop clock, measuring until there is zero light intensity getting through the solution.
Although I feel enough results were found to prove my prediction, further sets of results such as 15,25,35% concentration, could have been gained to ensure my prediction was indeed correct if time had allowed it.
Anomalous Results
Throughout my investigation I only encountered one anomalous result, in the 70% concentration experiment. The possible cause for this result is that the person measuring out the sodium thiosulphate and water failed to mark the bulbpepette so as to distinguish what they contained. Subsequently, I believe it was at this point when she mixed the bulbpepette up and had to rinse them out before starting again. I think that this anomaly is the result of this mix up, as maybe some residue remained in the bulbpepette, even after rinsing. Consquently this experiment was repeated, as stated in the plan, and a more credible result was gained.
Stability of conclusion.
As previously mentioned, with added time, more readings would have been taken to form a more accurate curve on the graph. However, I feel enough information was gained from each experiment to prove my the previously mentioned theory to be correct.