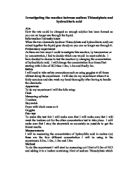
Theory of Reaction rates:
The Kinetic Theory states that an increase in temperature will make the particles go faster
The Collision Theory states that before a reaction can occur, the reactant particles must collide.
The Activation Energy Theory states that when particles collide, they must do so with sufficient force to overcome the energy barrier (activation energy) – only then will the collision be successful and products made.
I have obtained this background information from previous science lessons.
Equipment needed
Beaker for the reactants
- 2 pipets for each of the reactants
- 2 measuring cylinders for each of the reactants
- 1 conical flasks for the reactants
- 1 bunsen burner to heat the reactants up
- 1 tripod
- 1 gauze
- 1 heatproof mat
- 1 stopwatch to time the reaction
- A pair of tongs
- A pair of goggles for protection
- An X board
Method
- Collect equipment needed
- Draw a clear cross on the tile, and put it underneath the beaker
- Pour in the substances
- Start the stopwatches as the two reactants are mixed together
- Watch the tile where the cross is, and see how long it takes for the cross to disappear.
- Record the time
- Wash the equipment out.
- Repeat experiment if necessary for a more accurate result.
- Change a variable e.g temperature of the reactants or the concentration you are using.
- Do the experiment again recording the time- .Write down the results-
- For a much accurate result, do each experiment 3 times, to find an overall average.
-
When doing the temperature experiment, increase the temperature 10 oC to 80 oC each time and record the result. The concentration of the reactans must be kept constant throughout the temperature experiment because only one variable can be changed at a time.
-
When doing the concentration experiment, increase the concentration of the Sodium Thiosulphate by 5g/dm3 each time and record the result. The temperature of the two reactants must be kept constant throughout this experiment.
My Prediction
I predict that when the temperature rises, the rate of the reaction will increase. This is because when the temperature of a liquid is increased, the particles have more energy and move a lot faster. Therefore they will collide more often and with more energy. Particles with more energy are more likely to overcome the activation energy barrier to reaction and consequently react successfully. Activation energy is energy needed to start a reaction. The more collisions between particles in a given time, the faster the reaction. I also predict that when the concentration of the reactants is increased, the rate of the reaction will also increase. This is because if solutions of reacting particles are made more concentrated, there are more particles to collide with, making the reaction happen faster.
Using this background information to backup my prediction, I believe that the higher the temperature, the quicker the reaction and the higher the concentration, the quicker the reaction. I will carry out the experiment using the method stated, and record my results in a table so the results are easy to see and easy to plot on a graph. If my prediction is right, the results graphs will have a negative correlation for both variables used as I predicted that the reaction would go faster the higher the temperature and concentration.
Temperature
One variable I have chosen to investigate is temperature. I will change the temperature of the reactants, but keep the concentration the same. Keeping the concentration constant will make the experiment a fair test, as only one variable should be changed each time.
Concentration
The second variable I have decided to experiment with is concentration. While experimenting with concentration I must have a constant temperature present throughout, that does not change for a fair test and because only one variable can be changed at a time.
Obtaining Evidence
Here are the results of my experiment:
-
The first variable I decided to change was temperature. I picked a suitable range of measurements to obtain my results from. I recorded the results every 10 oC temp rise from 10 oC to 80 oC and recorded them in a table. The volume of Sodium Thiosulphate and HCl were kept at a constant volume of 100cm throughout this experiment, as we must only change one variable at a time for a fair test.
-
The second variable I have decided to change is the concentration of the reactants. I will use 5cm3 of HCl and keep the concentration of the HCl at a constant of 1 mol/dm3. I will use 15cm3 of Sodium Thiosulphate but use a varying concentration from 10 to 40g/dm3 going up 5g/dm3 each time.
Analysis
In this experiment I have found that as the temperature is increased, the time taken for the reaction to take place decreases. This would be because when the particles are heated, they move around more and more collisions would happen. Similarly, as the concentration of Sodium Thiosulphate is increased, the rate of reaction will also increase. This is why in each of my graphs there is a negative correlation meaning that meaning that as the temperature and concentration increased, the time taken for the reaction to take place decreases.
= Positive correlation = Negative correlation
I found that my prediction was right, as a predicted that as the temperature and correlation increased; the rate of reaction would also increase.
In the temperature experiment, the first two temperature increases from 10 oC to 20 oC brought a decrease of more than 60 seconds for both temperatures. So there is more than a minutes difference between the 2 temperatures.
10 0c 250 seconds
-66
-
0c 184 seconds
-62
After 30 oC the seconds decrease between the temperatures are less than at the start of the experiment at 10 oC. This is because at the start of the experiment, it proceeds quickly, but then goes to a steadier rate.
The pattern I have spotted in my results for the temperature increase experiment is that the lower the temperature, the more seconds are taken off, for example from 10 oC to 20 oC there is a 66 second less time for the reaction to occur. But as the temperature increases, the second interval between the temperatures decreases, for example from 40 oC to 50 oC there is a 9 second decrease in time for the reaction to occur.
-
oC 94 seconds
-9
50 oC 85 seconds
At the end of the temperature experiment from 70 oC to 80 oC, the seconds interval is a smaller number of 19 than the high 66 second interval from 10 oC to 20 oC. This is because at the end of the experiment the rate is much slower than from the start of the experiment.
In the concentration experiment, the reaction went fastest when the concentration of Sodium Thiosulphate was at its highest concentration (40 g/dm3) This would be because there were more particles to collide with and the collision rate increases, increasing the reaction rate. The slowest time the reaction occurred was at the start of the experiment when the concentration of the Sodium Thiousulphate was at a concentration of 10 g/dm3.
When the concentration was between 30 and 35 g/dm3 the rate decreased more than double the amount from 56 seconds to 27 seconds. This shows that there are far more collisions at a concentration of 35 g/dm3 than at 30 g/dm3. Also, from 35 g/dm3 to 40 g/dm3 the rate decreased almost double the amount from 27 seconds to 14 seconds.
30 g/dm3 56 seconds
-29
35 g/dm3 27 seconds
-13
-
g/dm3 14 seconds
These results prove that what I was predicted was right, when the temperature and concentration is increased of a reactant, the rate of the reaction will in most cases increase too.
An anomalous result is a result that does not go along with a pattern, or does not fit the pattern like most other results do. I found one anomalous result when doing the temperature experiment. Between 30 and 40 0C instead of the rate of reaction increasing, it decreases, throwing off the smooth curved pattern on the graph, and so in my average results, I tried not to add this result in so the graph was a lot more curved and didn’t have an anomalous result.
Comparing the two average graphs for temperature and concentration, I found that the concentration graph was steeper than the temperature graph meaning that the decrease in time taken for the reaction was far more rapid.
Evaluation
Overall, I think that my experiment went quite well and was quite reliable although there were some things that I could have changed to make the experiment more reliable and accurate.
One point was that when watching the X board to see when the cross had disappeared, I took my eyes off it several times and so may not have spotted when exactly the cross disappeared, and looking at it from different angles and distances could have given me wrong results. To make the experiment more accurate I would always keep my eye on the cross from the same place each time and not look away until the cross disappears.
When viewing my results, I found one anomalous result, which I didn’t include, in my average graph. This made the curve of the graph a lot smoother, making it much easier to draw a line of best fit.
To get more evidence and have a wider range of results I could repeat each experiment several times. This would give me more results and could also be more accurate.
To extend the experiment I could think about using a different range of concentrations to use. For example instead of keeping with increasing the concentration of Sodium Thiosulphate 5 g/dm3, I could increase the concentration by 1 g/dm3 for much more accurate results. Same for the temperature experiment, I could use a wider range of temperatures to collect results from, which would give me a wider range and more accurate results.