We decided to use Constantan for our real experiment because it had a greater resistance than Nickel Chrome, which would mean that temperature would have less of an effect on its resistance, making our investigation more accurate.
Prediction
I predict that the greater the length of wire, the greater the resistance of that wire will be. The length of the wire and the resistance of the wire should be directly proportional. This is because if resistance occurs as the result of collisions between charge carriers and the atoms of the wire, then there is likely to be more collisions in a longer wire. More collisions would mean more resistance. If the other variables stay constant, like the temperature and strength of the battery, the graph of my results should show a straight line.
Length of Wire (cm)
Variables
The controlled variables will be the room temperature and the wire material, because both will have an effect on the resistance if they are not controlled. The dependant variable would be the resistance, because it is dependant on the length of wire. The independent variable would be, in this particular investigation, the length of the wire.
Method
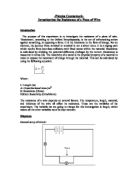
A 100cm long wire was taped to a metre ruler. At each end of the wire was a crocodile clip, which was connected to a battery and an ammeter in series. A voltmeter was connected in parallel with the length of wire. The crocodile clips were moved down the wire and the voltage and current were recorded at 20cm, 40cm, 60cm, 80cm, and 100cm. Then, the resistance was worked out by dividing the current by the voltage. The experiment was repeated 3 times for each length of wire and an average was found, to make it a fair test and to eliminate any anomalies.
Apparatus
1 x Power Supply
1 x Voltmeter
1 x Ammeter
5 x wires (with crocodile clips)
Wire of varied length
Safety
Whilst doing the experiment some safety aspects have to be taken into consideration. Crocodile clips can be dangerous if misused, and should not be touched when connected up in a circuit, as they are conductors of electricity and can deliver an electric shock. The wire can heat up if the current is too high, and this could cause burns, so caution must be taken when handling the wire.
Results
Analysis
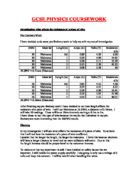
From the graph of my results, I can see that my prediction was correct. I predicted that the graph would show a straight line, running through the origin, as the length of a wire is directly proportional to the resistance of a wire. My line of best fit went through most of the points on my graph, and there is an obvious positive relationship illustrated in my graph. The resistance went from 1.27Ω (20cm) up to 6.32Ω (100cm). my two prediction statements were that the resistance would increase as the length of the wire increased, and that the relationship would show that length is directly proportional to the resistance. My graph shows this, so the investigation was a successful one.
Evaluation
From my graph and results table, I can quite confidently say that my results were accurate and reliable. Each length was repeated three times, to eliminate any anomalies, and an average of the three results was used to plot the graph. The preliminary experiment was helpful, because it made me realise that using Constantan instead of Nickel Chrome would decrease the effect of temperature on the resistance, as the material has a higher resistance already. After I had carried out all the repeats I took the average and calculated the resistance using the formula Voltage = Current X Resistance. By doing this my results are more accurate and exact.
Almost all of my points lay on my line of best fit, meaning my results were accurate, and the few that were a bit off were probably due to small inaccuracies developing from inaccurate use of equipment. For example, the wire being taped the ruler could have been looser for one point, and could therefore have been longer than the intended length to be tested. However, overall my investigation was successful, as I can draw firm conclusions from my results and my graph follows a trend.
Alternative Investigations
There are a few other investigations which could have been carried out to investigate the resistance of wire. One obvious one could be to change the thickness of the wire. This would be carried out the same way as this experiment (the circuit would be set up similarly) however instead of changing the length of the wire each time the thickness of the wire would be changed. For example the thickness could be changed by 0.1mm each time, so the resistance would be measured for wires of the following thicknesses: 0.1mm, 0.2mm, 0.3mm, 0.4mm, all the way to 1mm. After the results for this have been found they would be tabulated and plotted on a graph, the only difference being that the x-axis would be showing the width (mm). I would predict that the thickness of the wire would also be directly proportional to the resistance, as the thinner the wire, the less space electrons have to pass through.