I have the experiment set up and I have to measure the current going through the wires and then using the formula R=V/I I can find out the resistance in the pieces of wire. The ammeter reads the current and the voltage remains the same from the power pack.
I will be taking 10 readings so I can obtain good readings.
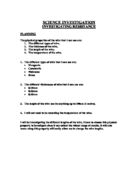
You could change the variables, to also find out how much resistance there is in a wire. The variables are:
- Cross-sectional area
- Composition of the wire
- Current
- Voltage
The variable I have chosen is the length of the wire.
I will make my test fair by:
- Not changing the cross-sectional area of the wire
- Not changing the composition of the wire
- Not changing the current
- Not changing the voltage
- Keeping the same wire – although the composition may be the same, I will use the same wire all the way though, for accuracy.
- Turning off the power pack after each reading of the length. If I kept the power pack on the wire could get hot, causing the electrons to have more energy, collide more and make the resistance higher.
The only thing I will change is the length of the wire, and I will keep the same voltage from the power pack, which is 6.
I will repeat each experiment 3 times to make sure I have reliable results, from which I can calculate an average.
I can calculate the theoretical resistance for the wire using the formula
R= Pl R= Resistance
•a P= Resistivity
L= Length in metres
A= cross sectional area in m
The resistivity of copper = 1.7 Χ 10 ohm per metre
So far is 1m length diameter = 0.1mm (1 X 10 )
Radius = 5 X 10 m
I will make my experiment safe by:
- Not touching the wire
- Using a suitable voltage for the wire thickness
- Making sure everything is in good working order for example none of the wires are split or broken
Although I have taken precautions to make my test fair, I find that if I leave the power pack on the wire gets hot. This means the resistance would have increased because as it gets hot the electrons in the wire have more kinetic energy and move faster. As the electrons move faster and collide more, the current cant get through so the resistance rises and current falls. I have now found this fault, so I am going to turn off my power pack in between each reading so the wire gets to cool down and the test is fairer.
I got all my information from Physics for you by Keith Johnson.
These are my results from testing the wire.
I then take these results and use the formula R=V/I.
Take the voltage, which is 6 and divide it by the average current.
Now I have found the resistance in the wire, I plot the results on a line graph.
Evaluation
This is a miniature version of the graph I have produced to show the resistance in a wire, the other graph is more accurate but this is just to show at the moment what it generally looks like.
I had to find the average of amps in the different wires because I did 3 experiments – I worked out the average current by adding the 3 results together and then dividing that by three because that’s how many results there were. I then take these averages and the formula R=V/I
I take the voltage, which is 6 and divide it by the current for example –
Volts / Average = resistance in ohms
6 7.70 = 0.77
As the length of the wire increases so does the resistance – this is the trend in my results, the same as my prediction. You can see this in on my large graph and the one above. I found that resistors in series are added together to give total resistance, so each length of wire is like a resistor. Adding 10cm is like adding on another resistor.
On the graph the line of best fit does not go through the origin. I think this is because the wires and crocodile clips used to attach the circuit together add onto the amount of metal that the electrons have to flow through, also the connecting wire is made out of copper and I am finding the total resistance of the circuit. The connective leads are approximately 10 cm’s each and the graph suggests 17.5cm. This is a close number to 20 so I believe that it is quite accurate.
The calculated resistance from the results show a figure of 3.17 ohm’s at one metre, this is greater than the predicted resistance of 2.16 ohm’s, I believe this can partly be accounted for by the resistance of the connecting wires which added roughly 20cm’s to the circuit. The crocodile clips and ammeter will also have some resistance.
I found that as I increased the length of the wire the resistance also increased, this is because the wire is made up of atoms, and as you increase the length of the wire the atoms inside it also increase. As the current passes through the wire it collides with the atoms in the wire and there are more atoms and less current it is harder for the current to get through. My graph shows and my results show that as the length of the wire increases so does the resistance. My results are quite good, I have no rouge results and my results are relatively on the line of best fit.
I believe that the results collected are sufficient to have firm conclusions, but the more results you have the more firm conclusions can be drawn.
I could improve my experiment by using a wire with a higher resistivity than copper; this would minimize the effects of the circuit wires on the final readings. I could have used Nichrome, which has a resistivity of about 65 times higher than copper.