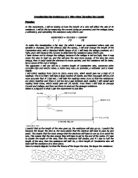
Below is a diagram is what I plan the experiment to look like:
I predict that as the length of the wire goes up, the resistance will also go up. I predict this because the longer the wire is, the more atoms that the electron will have to pass by and avoid. This means that the more energy that the electrons will have to use up in to avoid the ions. This means that the less energy they will have to get to the end of the metre. If I was to double the length of the wire, then the resistance will double, and if I was to half the length of the wire, then the resistance will half. So, a 25cm length of Constantine wire will have half the resistance of a 50cm piece.
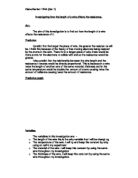
Here is a simple diagram to show the theory of the longer the wire, the larger the resistance:
You can see from these diagrams that when the wire is longer, then the electron route, the red arrow, will have to travel further and make more diversions. My hypothesis will be for this investigation, as the length goes up, the resistance goes up. You can look in the preliminary work section of this investigation for more, found from the Focus on Science computer program, which looked at altering the SWG rather than the length, but it will also have the same affect.
The Focus on Science program has effect the way that I will do the experiment quite a lot. It has been the basis of choosing what type of wire I chose, because I did not want a wire with too big of a resistance, like Nichrome, because this would result in a large current, which would be hard to measure accurately. I also did not want a wire with too small a resistance, such as Copper, as this would give a low current, which also would be hard too read on the ammeter.
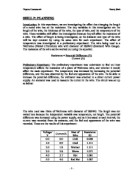
Obtaining
Current and Voltage Reading Set 1
Current and Voltage Reading Set 2
Current and Voltage Reading Set 3
Current and Voltage Reading Set 4
Current and Voltage Reading Set 5
Average Resistance
Analysis
I can see from my graph that the resistance of a wire is directly proportional to its length, which means that as the wire’s length increases, then so does its resistance. I can see this because when the wire is 20cm, then the resistance is 3.63 , and I would expect that when the wire is 40cm, then the resistance will be double this, which from my results it is (2.07 times). When the wire is 25cm, the resistance is 4.44 , and when the wire is 50cm long, it is 9.62 , which is roughly 2.16 times as large, almost double. Also, when the wire is 15cm long, the resistance should be half of what it was when it was 30cm long. In my results, 30cm of wire has about 1.9 times the resistance of a 15cm wire. The reasons they may no be perfectly accurate I will mention in my Evaluation.
From the graph, I can see that my prediction was correct, and that as the length of the wire goes up, so does the resistance. This is because the longer the wire is, the more atoms that the electron will have to pass by and avoid. This means that the more energy that the electrons will have to use up in to avoid the ions. This means that the less energy they will have to get to the end of the metre, and the fewer electrons that will make it to the end of the wire per second.
And, as I said earlier, if the length of wire doubles, then so will the resistance. But, in my investigation, you can see that the resistance of a length of wire 50cm long is not twice as large as the resistance of a length of wire 25cm long. This could be caused by many things, which I will mention in my evaluation, but I believe that it is still true, and only appears to be untrue because of flaws in my experiment, not in the science itself.
Evaluation
Overall, I thought that my experiment went quite well. I thought that it was done to the best that I could, but there could be things that could be changed. In my experiment I used an analogue ammeter and voltmeter (by which I mean one where the dial is a needle), and this is not a precise way to measure the current/voltage. This is because depending with what angle you look at it, the reading could change by up to half a unit, which means you have to look at it dead on straight. A good way to combat this would be to use a digital ammeter/voltmeter. But because I didn’t have these facilities, I had to use an analogue one.
Measuring the current or voltage was hard with analogue equipment, measuring the length of the wire was hard. The ruler flat, so there was no accurate way of telling you whether you were on 10cm, or on 11cm, which would have made a critical difference.
My average graph shows that there are a few anomalous points: those being towards the higher lengths of wire (at 50cm and 55cm). This may be caused by the fact that as the current goes down, it can be harder to see what the value on the ammeter says. This is because the gaps between the current between the readings become closer, sometimes by only 0.1 of an amp, and this makes it hard to see whether the current has even changed.
Anomalous points could also have been down to things out of my control, such as changes in the resistance that would happen in every experiment like this unknown. This could be from heating of the wire, because of the voltage going through it which made it heat up, which is sometimes noticeable from touching it. Resistance could have been added in the crocodile clips, the ammeter and voltmeter, and other connecting wires. These are things that I had little or no control over, and would have gone on without me knowing. The only way to stop this is to use low resistance wires and measuring devices (ammeter/voltmeter).
From the Focus on Science program, which I used in the plan to help construct the experiment well, they have given the resistance for 1m of Constantine wire with a Standard Width Gauge of 36. Since I only went up to 55cm of Constantine wire, I will have to go by the scientific knowledge I used earlier, in saying that ‘Double the length, double the Resistance’. So, if I was to double the resistance of 50cm of wire, then it should be the same as the result on the Focus on Science program. But, it is not.
When I worked out in my experiment what the resistance of 1m of Constantine wire is, it was different to that on the Focus on Science program. This could be down to many things I mentioned earlier during the Evaluation. When they did their experiment, they would have made sure that there would be no other factors effecting resistance, but in mine, this would not have been possible because I did not have the facilities to.
On the whole, the graph of average resistance follows the pattern that I expected it to, but with a chance, I would like to do it again, and hopefully get a better graph out of it. If I could do it again, I would like to, because I could see if my experiment was correct, rather than seeing what problems there were in getting the results out of it.
Ryan Edwards