R = V
I
Factors That Affect Resistance
Temperature is one of the main factors that affect the resistance of a wire. If a metal is heated, the metal ions in it will vibrate more. This means that there is a greater chance of an electron bumping into a metal ion so the flow of electrons is reduced (i.e. the resistance is increased). An analogy of this theory is to imagine an individual walking through a crowd of people (who in this case are metal ions and the individual the electron). If the crowd are standing still (similar to soldiers on parade), the individual can easily move through by walking along the lines between the soldiers. However if the subject individual tries to cross a crowded dance floor where people are moving about in all directions, It would be more likely for him to bump into someone and thus his overall speed is reduced (similar to the reduction of current in the wire).
The cross-sectional area of a wire is also a factor affects the resistance of a conductor. A wider cross-sectional area of a wire will allow more electrons through it and thus increasing the current. A narrower cross-sectional area would allow less current passage and thus increasing resistance The length of a wire also contributes to being a factor that affects resistance. A shorter length would allow more electrons to pass through it at a higher rate than a longer one.
Resistivity
Electrical resistivity (also referred to as specific electrical resistance) is a measure of how strongly a material opposes the flow of electric current. It is the per unit length and per unit reciprocal cross-sectional area of a given material at a specified temperature.
Deriving the resistivity formula
For a piece of material of length ( l ) and cross-sectional (A), the resistance is directly proportional to the length of the conductor
R α L
And is inversely proportional to the cross-sectional area
R α
Assuming that temperature is kept constant and the only other variable is the material itself, the resistance of a material would have a resistivity value per unit length which would have an equation of:
R = ρ
Rearranging the equation “ρ” (the resistivity) also known as the Greek letter rho would give:
ρ =
Resistivity has units of (resistance × area ÷ length) which is simplified as (resistance × length). So therefore its SI units are (Ωm). The numerical value of a material’s resistivity is the same as the resistance of a 1m long piece with a cross-sectional area of 1m2 (1 metre cube)
Equipments I will need (Apparatus)
- A 100cm of wire (found on the mummy) fixed onto a 1metre ruler
- A Micrometer- To measure diameter of wire
- Power supply- To generate electricity
- Analogue Ammeter with shunt fixed on it-To measure current
- Digital Voltmeter-to measure voltage
- Variable resistor- to change resistance gradually
- Connecting wires
Method
- Firstly, measure the diameter of the wire at 6 different lengths using a micrometer and workout the mean diameter of the wire.
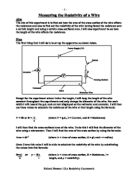
- Set up experiment as shown in the diagram
- Connect power supply to ammeter (using connecting wires) and from the ammeter to the research wire using a connecting wire clip
- Connect the other end of the research wire to the variable resistor (again using a wire clip) and from the variable resistor to the power supply
- Connect the voltmeter in parallel to the wire (as voltmeters have high resistance and will not let current through if connected in series).
- Make sure the ammeter and voltmeter reading is zero before turning on power supply
- After power supply is turned on, change the resistance of the circuit by the use of the variable resistor and take accurate measurements of the current and voltage using the ammeter and voltmeter when resistance is changed.
- If the wire gets hot after when measurements have been taken, wait until the wire cools down before taking next measurement in order to prevent biased data.
- Carry out 8 experiments and repeat any test if necessary.
- When all measurements have been taken, insert them into a well structured table containing units, headings etc and draw a correlation graph to work out median resistance (R=V/I) and also observe the relationship between voltage and current.
-
Using the calculated mean diameter of wire, calculate the radius and cross-sectional area of wire using the formula πr2 and work out the resistivity of the wire using the formula (ρ = RA / L)
Safety
There are quite a few precautions that I would need to take during the process of experimentation. The first quite obvious form danger is the use of the power supply which operates up to a maximum 240V (enough to cause a fatal accident). Improper use and abuse of the power supply could seriously result in electrical shocks.
Another form of hazard which is quite mild is when trailing wires are left around unattended to. This could potentially cause accidents whereby individuals working around the experimental area could slip and fall over. Also I will make sure that I do not leave the circuit closed when it is not in use and also take precautions when handling hot wires as it may cause slight burns to the skin if hot to certain degree.
Variables
In order to make this experiment a fair test, I will ensure that the temperature is kept constant throughout the experiment in order to keep my data fair and not biased. Also to ensure more accurate data when recording measurements of the diameter of the wire, I will make sure I take eight readings of this measurement and find the mean of the eight results in order to gain more a precise data.
Another important factor of accuracy I would need to take note of when taking measurements is the para1lax error. This is an error that can be introduced when data is not read from an instrument directly from its front, due to the separation of the indicator and the scale being read. Great care is going to be taken when data is being read.
Sensitivity
In my apparatus that I will use, the analogue ammeter and the digital voltmeter which measures current and voltage in my experiment will be very sensitive. This means that they will detect and respond to very small changes in resistance and voltage if they are supposedly changed through the variable resistor. The ammeter (which measures to an accuracy of 10-3) will detect small changes in current and the voltmeter (which measures to an accuracy of 0.01V) will detect small changes in voltage.
Results
From micrometer measurements
Mean = sum of data divided by the sample size
Therefore mean = 0.567 + 0.563 + 0.563 + 0.563 + 0.564 + 0.569 + 0.566
6
Mean = 0.565 mm
Diameter of wire = 5.65 × 10⁻⁴ m
From main experiment
I will now draw a correlation graph of current against voltage that I can conclude from.
Please turn over to see graph
Calculations
From the graph,
Therefore Resistance = Voltage
Current
Current = 30mA (please check graph)
Voltage = 0.06 V (please check graph)
Therefore = 0.06 = 2 Ω
0.03
Mean diameter of wire = 5.65 × 10⁻⁴ m
Area = πr2
Radius = Diameter = 5.65 × 10⁻⁴ m = 2.825 × 10⁻⁴ m
2 2
Therefore Area (πr2) = π × (2.825× 10⁻⁴) 2
Area = 2.507× 10⁻⁷ m2.
Resistivity (ρ) =
Therefore resistivity = 2 × (2.507× 10-7)
1
= 5.014 × 10⁻⁷
1 metre
These calculations conclude that the resistivity of the wire is 5.014 × 10⁻⁷ Ωm.
Interpreting And Evaluations
From interpreting the look of the graph, there is a positive correlation between the current and the voltage. This is evidenced by the straight line through the origin of the graph. The error bars drawn on the graph is to show the range of data my measurements could possibly be at if the instruments I used were accurate to higher significant figures. In interpreting the graph, when the potential difference is increased, there is more electron charge flow from the emf of the electrical supply to the desired components of the circuit.
To compare and contrast the resistivity of the wire investigated with the resistivities of contemporary wires available today in order to conclude whether it is made from a modern alloy, I have pasted a table from a datasheet book containing the resistivities of the different types of modern wires available today.
Looking at the table above and comparing it with my calculated resistivity value of 50.14 × 10⁻⁸ Ωm (decimal moved one place to the right), I will conclude that my calculated value is quite similar to that of constantan which has a value of 49 × 10-8 Ωm. This concludes that the mummy is of a fake one because constantan wire is a modern wire which was not available in 2,600 years ago.
The reason why there is some variation between the datasheet value and my calculated value in my opinion is because of the fact that there were some limitations that were encountered during experimentation. These were:
- The imperfections of the thinness and thickness of the wire at different lengths
- The crookedness of the wire which was not straight.
- The number of significant figures that the ammeter and voltmeter were able to measured up to.
During the process of measuring the thickness of the wire using the micrometer, the wire was a bit thick on one end and very thin on another end. This which might be caused by pressure being applied on the wire accidentally (bending it) and in my opinion affected the calculation of the cross sectional area of the wire (πr2) which also affected the calculated resistivity of the wire.
Another important factor contributing to the variation between my value of resistivity with published data values is the crookedness of the wire. This is so because the wire at visual contact was not straight and if a wire is not that straight, there would be additional length discretely added onto it without noticing until the wire is accurately straightened and properly measured. Because resistivity is measured in ohms per meter and when we were given the wire which was fixed onto a 1 metre graduated ruler, we assumed the wire was 1 metre as well and this ultimately was quite not and resulted in my opinion some variation between the published data values and my calculated value of resistivity.
Also another factor was the number of significant figures that the ammeter and voltmeter were able to measure up to. Although they measure up to three significant figures, the published data values had instruments that were able to measure up to five or more significant figures and although this makes little difference, it contributes to the factors that causes little variations.
Measuring The Uncertainty
As stated earlier, my calculated value of resistivity was not of the same as published data values. Due to limitations previously discussed qualitatively, I am now going to quantitatively calculate the percentage uncertainty (error) of my data to see how inaccurate they are.
Percentage error = Error in reading
Average value
Micrometer
% error = 0.001mm
0.565mm
= 0.176 %.
This is percentage error is not significantly high as it is under 1% so therefore the micrometer measurements were quite accurate to my surprise. However, because they do not correspond to my expectations in determining the percentage error of my calculations which was due to the instruments that was given to me, I will also calculate the percentage error for the voltmeter and ammeter as well to see which instrument carried the most percentage error which ultimately resulted in variation of my data with published data values.
Voltmeter
% error = 0.01
0.05
= 20 %.
The concludes that the voltmeter carries a slight degree of error associated with the voltmeter measurements I took and this ultimately causes a clear distinction between published data values and my value. In future experiments, I will use a different and a more accurate voltmeter for precise measurements.
Ammeter
% error = 1mm
25mm
= 4%
Although this percentage uncertainty value is also not significantly high, it also contributes to variation between data sheet values and my value. This percentage error in opinion was caused from using an analogue ammeter to measure the current. I had to manually measure the current with my eye considering the parallax error and factors of that nature although I had considered these factors earlier in my plan. Because an analogue ammeter was used, I was unable to measure the current to a satisfying degree of accuracy. In future experiments, I will improve the measurements of current using a digital ammeter.
Bibliography
- AS physics, isbn: 0435628925
- http://hyperphysics.phy-astr.gsu.edu/HBASE/Tables/rstiv.html