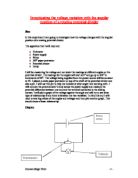
Diagram
Safety
There are no serious safety precautions in this experiment. I will just need to make sure that the voltage of the power supply is not too high as this may cause the potential divider to blow.
Fair Test
To make this experiment fair I will need to make sure that as I turn the paper protractor that is accurately shows the correct angle. This will need to be done by human judgement.
Accuracy
I will carry out this experiment three times which will decrease the chance of any obvious mistakes. I will then work out the averages in a separate table and use these values to plot a graph of voltage against angle.
Precision & Sensitivity
The voltmeter has a precision of 0.01V.
The angle of the potentiometer has a precision of 10o.
The sensitivity of the voltmeter is accurate enough for this experiment as if I had any more values (e.g. precision of 0.001V) it would be difficult to plot a graph and then read the readings.
The sensitivity of the potentiometer is suitable for this experiment as it has a precision of 10o but I will be increasing the angle in increments of 20o.
Theory
A potentiometer is used to measure the potential in a circuit In this experiment an angular potentiometer is going to be used as a potential divider. The way it works is a certain length of wire is coiled into a circle. The shaft is connected to the angular slider and so when you turn it you will change the angle. This increases or decreases the voltage. The diagram shows a potentiometer in more detail.
Observations
The results have been recorded in the table below. As explained earlier, I have repeated this experiment three different times and so have three readings. Hence, I have taken an average voltage reading in order to plot a graph.
Analysis
The graph below has been plotted with respect to the angle of a potential divider and the voltage produced at the angle.
The graph clearly shows that as the angle of the potential divider is increased then so does the voltage. Therefore, the voltage is directly proportional to the angle as the graph shows a curve. The graph produced is not perfectly a curve and this may be due to the inaccuracy of measuring the angles. This is because to set a certain angle it has to be done by human judgement and of course this is not accurate at all.
Log graph
We are dealing with the angle, ‘a’ of a potential divider, and its voltage, ‘V’ . Assuming that they are related to each other as follows: V = kan, where k and n are unknown constants, not necessarily integers.
Take logs of both sides of the equation:
log V = log (kan)
log V = log k + log an
log V = log k + n log a
Comparing this to the standard x-y graph, i.e. y = mx + c, we find the following:
y = log V, x = log a
m = n, c = log k
Hence, a graph of logV against loga will yield a straight-line relationship, gradient n and y-intercept logk.
I have taken logs values of the angle and the voltage and the graph is shown below.
The above graph of logs shows that there is a roughly a straight line relationship between the angle and the voltage. Therefore this means that there is a strong relationship between the angle and the voltage.
Evaluation
I conclude that the voltage is directly proportional to the angle of the potentiometer. In other words, as the angle is increased then so will the voltage. From analysing the graph I can say that the experiment went fairly well and a smooth curve is plotted. However, the graph is not perfectly a curve and this is because of human error. As I changed the angle of the potentiometer I had to make sure that it was accurately on a multiple of 20. However, this could only be done by human judgement so therefore there could be an error of about 1-2 degrees. This has not affected my results in such a way that I have any anomalous results.
The log graph proves that there is a relationship between the angle of a potentiometer and it’s potential. This can be seen by the almost straight line produced. As I have mentioned before, the line is not perfect as there was inaccuracy in measuring the angles.
If I was to repeat this experiment again I would use something that is more precise in telling me what the angle of the potentiometer was. In this experiment the controlled variable was the angle. I could also have controlled the voltage and then worked out which angle gives certain voltages.