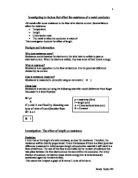
R=ρl
A
If ρ and A are fixed by choosing one
type of wire of one diameter then:
R= k x l
R l
Investigation- The affect of length on resistance
Prediction
I think that as the length of a wire increases, so does the resistance. Therefore, the resistance will be directly proportional. I think this because if there is a fixed potential difference (measured in volts) across a length of conductive material it will result in a flow of electrons. The rate of this flow is controlled by the number of collisions that take place between the free electrons and the atom within the conductor. For a tiny fraction of a second, the electron loses kinetic energy, but is instantaneously accelerated again by the electric field.
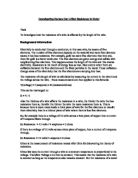
This means that I expect a graph of R versus L to be of the form:
R
L
Method
- Set up the apparatus as shown in the diagram above.
- Place the free end of the wire at 0cm on the metre rule and record the readings from the voltmeter and ammeter.
- Repeat process every 5cm up to 100cm.
- Then repeat the entire experiment and work out the averages.
- Work out resistance using ohm’s law (see background info).
- Make sure you keep the temperature of the room constant throughout the experiment because the hotter the wire, the more resistance. The same wire should also be used throughout the experiment.
Apparatus
- Reasonably this wire so it doesn’t change in temperature so easily
- An ammeter
- A voltmeter
- Connecting wires and crocodile clips
- A metre rule
Results
Conclusion
From this experiment it can be concluded that the longer a piece of wire is, the bigger the resistance. This conclusion matches my earlier prediction. There is a pattern because the resistance is directly proportional to the length, which is shown in the graph, as there is a straight line.
The data on the graph clearly indicates that a straight-line relationship exists without much need for finer discrimination. This agrees with my prediction to the extent that I have only tested one type of conducting wire of one diameter only. With the apparatus available, finer discrimination could have applied (to mm) but it is not thought necessary.
Evaluation
There were no anomalies in this experiment. I think that there was enough evidence collected to support my conclusion. My results were repeated and the scatter on the graph is very small. This implies that the reliability of the evidence is very good. If I could improve this experiment in any way, I would have used a greater length of wire and more readings, to 200cm maybe, and I would have repeated the experiment 3 times instead of 2. Also, it is important to minimise current in the circuit to reduce the effects of joule heating.