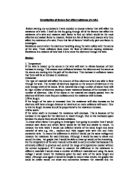
Diagram
How I will keep the experiment fair
The test will be kept fair as everything will be kept the same but the variable I am testing. For example, when I am testing to discover whether the length of the wire effects the resistance, the material and width of the wire will stay the same. Also, the current flowing through the wire will be kept the same. This will be achieved by keeping the same number on the power pack. I will also take each result twice in case any mistakes are made.
Method
- I will set up the experiment as shown in the circuit diagram
- A current will be passed through the wire
- I will record the readings of the ammeter and the voltmeter
- These results will be used to record the resistance of the wire (R= I/V)
- I will change the length of the wire and record the different results for each length
- I will only change the length of the wire keeping the material and cross sectional area of the wire the same
- The experiment will then be repeated twice more as above but instead of changing the length; I will change the cross sectional area and then the material of the wire
Results
When the length of the wire was varied
1st Set
2nd set
When the width of the wire was varied
1st Set
2nd set
When the material was changed
1st set
2nd set
Conclusion
From the results I can conclude that if the length of the wire is increased the resistance will also increase. The longer the wire the more atoms there are in the wire so the greater the chance of collisions between the atoms in the wire and the electrons in the current meaning the resistance has increased. If a 10-cm length of wire is doubled to 20 cm there will be double the amount of atoms and so double the resistance. You can draw this conclusion from the results
1.23 x 2 = 2.46. The resistance has roughly doubled from when the length of the wire was 10 cm to when it was doubled to 20 cm.
The graph also shows that the resistance of a wire is proportional to the length of the wire. I know this because the line of best fit is a straight line showing that if the length of the wire is increased then the resistance of the wire will also be increased.
From the results when I changed the cross sectional area of the wire I can conclude that as the width of the wire increases then the resistance decreases. This is because there is increased space between the atoms of the wire. This means that the electrons in the current have more space to move around meaning there is less chance of collisions between the atoms and free electrons in the current and so less resistance in the wire.
From my results when I changed the material of the wire I have concluded that the material constantan has more atoms than the material nickel chrome. This is because the constantan results show a greater resistance so it is likely that there were more atoms in the material and so there would be more collisions with the free electrons in the current meaning more resistance.
Evaluation
I feel my investigation went well. My predictions about how the length and cross sectional area of a wire would effect the resistance were correct. I was unable to discover the densities of the constantan and nickel chrome so I cannot say for definite that my prediction is correct, as I do not know that there are more atoms in constantan than nickel chrome.
I measured the cross sectional area of the wire widths I could obtain using a micrometer for accuracy. I also took my results twice to make sure I had made no mistakes using the micrometer.
I know that all of my results were correct as they were also taken more than once to ensure no careless mistakes were made.
I feel I could have improved my investigation by drawing graphs for my results when I changed the variables of the material and cross sectional area of the wire. It was not possible to do this, however, through no fault of my own. It is not worth drawing a graph if you do not have more than five results. Because of an unfortunate lack of different wire materials and wire widths in the classroom I could not do take a wide enough range of results, so it was not worth drawing a graph. The graph I did construct to show how changing the wire length affects the resistance of the wire was done by working out an average of the two sets of results taken.