Apparatus:
- 15 potato cylinders- part of experiment
- Scalpel – to cut potatoes
- White cutting tile – to cut the potatoes
- Potato borer – to extract pieces of potato
- Syringe – measure solution
- Electrical weighing scales – to weigh potatoes
- Tissue paper – to dry the potatoes after osmosis takes place
- Measuring cylinders – to measure solutions
- Solutions – part of experiment
- Specimen tubes – hold solutions and carryout experiment
- Ruler – measure potato cylinders
Method:
A range of sucrose solutions have been ready prepared with concentrations of
- 0 molar
- 0.25 molar
- 0.5 molar
- 0.75 molar
- 1 molar
Sections of the potato will be extracted with a potato borer and then cut with a scalpel to size and weighed. This part of preparation must be done accurately in order not to change the surface area of the potato cylinders. I will use 10 millilitres of each concentration of sucrose solution and will label them once they are in the specimen tubes. I will record these results.
The potato pieces will then be placed in the tubes and then will be left for an hour. I will repeat the experiment 3 times in order to produce accurate results.
After the experiment has taken place the pieces of potato will be removed. The surface solution will be removed from the potato and then the potato will be re-weighed. I will also record these results. Then will work out the difference to display the results in my graph accurately.
- Use a potato borer to remove pieces of potato.
- Using a scalpel and a ruler cut the cylinders down to 5 cm taking safety into account with regards to the scalpel.
- After performing these two tasks, 15 potato cylinders should be produced as performing the test 3 times with 5 different sucrose solutions, 15 potato cylinders will be needed to fulfil my task.
- Using a pipette put the same amount of each different concentrated solution in a specimen tube and store safely.
- Weigh each individual potato cylinder on a weighing scale and recorded the results in a table.
- Put 3 potato cylinders into each specimen tube and store them in a safe place.
- 3 Chips were used to create an average, which gave a better set of results and a more accurate graph.
- After an hour passes drain out the solutions and place all the potato cylinders on a paper towel one by one recording the measurements and adding them to the table.
Throughout the experiment safety should always be taken into account. Whilst cutting the potato I had to be precise and careful with the scalpel. The measurements for the solutions had to be perfect in order to get the required results, making sure that all equipment is clean.
Hypothesis/Prediction:
I think that the lower the concentration of sugar the larger the mass of the potato. Due to my research I found this is because water molecules pass from a high concentration to a low concentration. Therefore the chips in higher water concentrations will have a higher mass than in higher sugar concentrations.
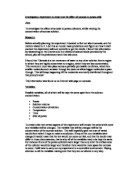
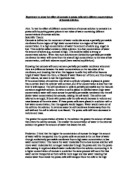
Results:
Graph:
Conclusion:
In this experiment I have collected enough accurate data to support my hypothesis. We can tell that these results are accurate because a general trend is show by them, and they are very close to the line of best fit. Upon the x-axis is the concentration of sucrose and upon the y-axis is the mass of the potato. Above the x-axis we see that the mass in the potato has been gained, therefore the potato cylinders will have held more water due to the effects of osmosis. The mass is increased because there is a higher water concentration and therefore water is pushed into the potato. Below the x-axis we see that the potatoes have decreased in mass. There is a higher sugar concentration in the solution and therefore water is pushes out of the potato. The potato will have held more sucrose solution and that is why the mass has decreased. From the results we can see that the higher the concentration of sucrose, the lower the mass. This is also shown in my prediction and hypothesis, which explains why the experiment went so well.
All the evidence that I have used to make a conclusion from is accurate and has proven to be reliable, as they have given accurate results.
Evaluation:
I believe the experiment went well. I collected enough sufficient data to carryout a fair and precise test. Everything was successful and my final results proved to be accurate and collaborated with my predictions, the chance of this was increased due to making the test fair and, repeating the test 3 times to gain precise data. But I believe that using more concentrations of sucrose solution will give more accurate results. I could have also organised the experiment a little better making sure everything is done perfectly. Apart from that there doesn’t seem to be anything wrong with my results as they clearly show the motive of the whole experiment, and show that osmosis takes place in different circumstances.