Sublitoral SEA 0% out of the sea
These factors give to the zonation pattern of the seaweed and thus the flat Periwinkles that feed on it.
BIOTIC FACTORS:
- Food distribution
- Predation pressures
- Competition for space and food
There will be intraspecific competition between the flat Periwinkle species. This competition will be for food and space to breed and live on. Zonation may occur because certain types of flat Periwinkles may be advantaged in the different habitats.
Interspecific competition between different species may also effect the distribution of flat Periwinkles on a sheltered shore. Adaptations may mean that some types of flat Periwinkles may be better adapted to survive in different niches, i.e. in an environment that consists of different organisms and different Abiotic and biotic factors.
PREDICTION:
I think that the mean size and colour of flat Periwinkles on a sheltered shore will be different on the two sorts of seaweed.
Where Fucus serratus grows, on the lower shore I am expecting most of the snail to be small and yellow. This is based on my preliminary work and background information from secondary sources. On Ascophyllum nodosum on the middle shore I am expecting all the snails to be bigger and olive green in colour.
Scientific knowledge behind my prediction:
From my preliminary work I can see that yellow flat Periwinkles live on Fucus serratus, which is under water for most of the year. Predators like fish and shore crabs are a threat from the sea.
Fucus serratus appears transparent when in water, light coming from underneath gives the appearance they are yellow, thus yellow snail will be camouflaged from predators. However Ascophyllum nodosum is exposed to predators from the air like birds. The seaweed is green brown so I am expecting the green Periwinkle, as this would be the more camouflaged colour.
I think the size may be different due to the predation factors and the life span of the snails found in the different seaweeds. If the life span of the snail is shorter than it is not going to reach such a big size.
METHOD:
Equipment required:
- Tray to collect snails in
- Callipers to measure the length of the flat Periwinkle accurate to 1mm
- Data sheet to record results on
- Calculator to calculate cumulative mean
- 1 meter square quadrat to mark perimeter of section
- Chalk and stone to mark centre of quadrat
- Clipboard, polybag, pencil for recording data with
- Cross staff to determine height of station
- Gloves to wear on hands to prevent getting so dirty
- Water proofs and welly boots to prevent getting wet when out in field
Callipers, these are accurate to the nearest mm. Measuring all the flat Periwinkles in this way will increase the precision of my data.
Strategy of collecting data:
Put water proofs on and wellies, this will mean staying dryer as the best way to collect all the snails is to get right down onto the ground and have you eyes very close to the
seaweed. Wearing rubber gloves will prevent them from getting to dirty; especially as the shore i'm going to be fairly muddy. At 3.16 on the 26th August 2002 Extreme Low Water springs is at 1.2m. Choose a random place on the shoreline. Use the cross staff, as explained in ext 1, to position your first station at 1.8m, this will be the Fucus serratus section on the lower shore. Place the meter quadrat on the seaweed. Check the percentage coverage of seaweed in the quadrat and record this on the data sheet. Systematically collect every flat Periwinkle from the quadrat and place them into the tray. Then measure the widest part of the snail, record this on the data sheet along with the number of snails collected so far and the colour of each snail. Once all the snails have been done from this quadrat they can be put back into the seaweed, not on the surface where they are a likely target to predators. It is then necessary to calculate the cumulative total and the cumulative mean.
Example
- Cumulative total = previous cumulative total + new measurement
- Cumulative mean = cumulative total / periwinkle number
The idea of calculating the cumulative mean is to know when I have collected enough data. After I have calculated all the values I will look to see if they have evened out for at least 5 consecutive numbers, if they have not then it will be necessary to do another quadrat. For details on how to find the next quadrat on the same station see ext 2. A percentage difference of less than 1% is good, so I shall aim for this. Even if the cumulative mean has evened out it is important to finish the quadrat to avoid obtaining bias results in which you may have picked certain snail in the quadrat. It is thus also important to collect all the snails in the quadrat to improve accuracy.
After finishing a quadrat put a large stone with a chalk mark in the middle of the quadrat, this is so I know where the quadrats are just in case. From this known point I can use the cross staff to increase my height to 3.6m where station 2 is, to the Ascophyllum nodosum section on the middle shore.
For station number two I will also need to collect all the flat periwinkles in the quadrat. They must all be measured in the same way as before and recorded with snail number and colour. When the whole quadrat is done calculate cumulative total and mean and assess the situation to see if another quadrat needs to be done. I will need to do at least 100 snails to obtain a suitable amount of data to make sure my results are more reliable and repeatable.
When both stations are done I have collected all the data.
I decided that the 1 meter square quadrat was a suitable size to collect enough flat Periwinkles but not that big that one person can easily manage it. If I were to use a quarter meter quadrat I would have to do many of these, it is more convenient to do it in one go.
I chose callipers, as they are accurate to 1mm, which is fairly good, a ruler would be harder to use and less accurate, especially as many of the snails are only a few millimetres big and thus are quite fiddly. This choice of equipment will increase the precision of my results and mean that the reliability of the experiment will be greater.
The cross staffs are exactly 0.6m, I checked this using a meter rule. The precision of my station height should be accurate which is important for the reliability of the results and the experiment should be successful on repetition.
The reliability of my results can be increased if I keep other variables constant. Many Abiotic factors I cannot control but if I collect data at the same time of year and on the same day, 26th august I can hope that they won’t change. These constants include wind direction and speed, humidity, sunlight, temperature and pressure. The period of emersion is the constant I am changing, station one is 1.8m and station two is 3.6m. However if it is necessary to do more than one quadrat at each station these must be done at the same height.
Other constants include.
Equipment used at each station.
Size of quadrat 1-meter square to avoid bias
Type of shore- sheltered red sandstone, muddy
Having only one variable will increase the fairness.
Dependant measured variable:
Size and colour of flat Periwinkle
Colour can be green, brown, yellow and orange
Flat topped with little spire
Measuring to nearest mm
Ext 1: how to use a cross staff:
The cross staffs are a height of 0.6m. I will need someone else to help me when to find the desired height. I will place the cross staff at my known height of 1.2m and then crouch down and look through the whole. A mirror reflects an image of a spirit level, this needs to be level. I can then look where it is aimed to, if I aim for someone’s wellies then the point where they are standing is my next point, 0.6m higher than previously.
Ext 2: Second quadrat at same station:
When a second quadrat needs to be done at the same station height it is important that the height is the same.
To achieve this I shall flip the quadrat to the right so it is at the same height as the first quadrat. The left side of the second quadrat is were the right side of the first was.
Mark the old and new centres of the quadrats with a stone marked with a chalk X so that you know where the centres of the quadrats are.
RESULTS:
STATION 2: Tally chart of lengths of flat Periwinkles found on Fucus serratus:
- Tally chart of lengths of green flat Periwinkles found on Fucus serratus:
- Tally chart of lengths of yellow flat Periwinkles found on Fucus serratus:
STATION 2: Tally chart of lengths of flat Periwinkles found on Ascophyllum nodosum:
These results are displayed graphically, labelled Graph 1, 2, 3 and 4. Both sets of data displayed a normal curve, both of which are slightly skewed.
STATION 1: Fucus serratus seaweed on lower shore
Green Periwnkles
Number: 180
Mean: 4.03
Standard deviation: 2.00
Yellow Periwinkles only green Periwinkles only
Number: 173 Number: 7.00
Mean: 3.89 Mean: 9.86
Standard deviation: 1.55 Standard deviation: 3.76
STATION 2: Ascophyllum nodosum seaweed on middle shore
Green and yellow Periwinkles
Number: 152
Mean: 13.17
Standard deviation: 2.09
Z TEST:
A test to see if there is a significant difference found in two sets of data. In this case whether the size of the Periwinkles is significantly different on the types of seaweed.
Z = | X1 – X2 |
S12 + S22
n1 n2
Z = (13.17 – 4.03) / √ ((2.092 / 152) + (2.002 / 180))
Z = 40.49
Degrees of freedom = ∞
Level of significance = 0.05, 95% certainty
Critical value = 1.960
Reject the Null Hypothesis that there is no significant difference in the size of flat Periwinkles on sheltered shores found on Fucus serratus and Ascophyllum nodosum. Z is significantly greater than the critical value showing there is a clear pattern of zonation.
Chi2 test: This test will be used to see if there is an association between the colour of the flat Periwinkle and the seaweeds it lives on and thus it location on the shore.
Colour distribution of flat Periwinkles on sheltered shore:
Colour on A. nodosum: green: 152
Colour on F. serratus: green: 7 yellow: 173
E expected result = row total x row column / total
Chi2 = ∑ (O-E) 2 / total
= ((152-36.53) 2 + (1-39.97) 2 + (7-42.97) 2 + (173-47.03) 2) / 666
= 32014 / 666 = 48.07
Degrees of freedom = 1
Level of significance = 0.01, 99% certain
Significant value = 6.63
The snails are not distributed at random on the shore. My chi-squared value of 48.07 is significantly greater than the significant value, which is 6.63. I will thus reject the null hypothesis that there is no significant difference in the colour of flat Periwinkles according the different seaweeds they live and feed on.
Based on my results and the two statistical tests I carried out I can thus reject all of my null hypothesis and can say that there is a significant difference in the colour and mean size of flat Periwinkles found on Fucus serratus and Ascophyllum nodosum seaweed on a sheltered shore.
DISCUSSION INTO WHY MY I OBTAINED THE RESULTS:
HYPOTHESIS: There is a significant difference in the mean size and colour of flat Periwinkles found on Fucus serratus and Ascophyllum nodosum seaweed on a sheltered rocky shore.
There could be several reasons as to why there is this distribution of flat Periwinkles on a sheltered shore:
The choice of habitat and niche could be due to their different feeding habits. The small dwarf yellow Periwinkles graze on epiphytes (small animals and algae that live on seaweed). These epiphytes live on Fucus serratus, which is on the lower shore and where I found all the yellow Periwinkles. There is little or no epiphytes living on Ascophyllum nodosum and the seaweed is tough and hard to eat, this may be a reason why I didn’t find any yellow dwarf Periwinkles on the middle shore on A. nodosum.
The big green flat Periwinkles graze on A. nodosum, which is predominately, found on the middle shore, this is where I found most of the green flat Periwinkles. They are however found all over the shore and I found 7 on the lower shore. Thus the chosen habitat of the flat Periwinkles is where there is plentiful food.
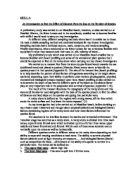
The flat Periwinkles may be different colours because of the food they eat and the chlorophyl pigment that comes from the food. They may start of on the lower shore when they are young and small feeding on F. serratus and then when they get old move to A. nodosum where they grow bigger and change green due to the food change. However if this was the case and the Periwinkles were yellow when small when they were young and then big and green when old, they would be expected to have a yellow core:
This is never found which means that this is not the reason for colour and size distribution between the middle and lower shore.
Two different species of flat Periwinkles:
Upon further research it became apparent that there are two different species of flat Periwinkles.
- Littorina obtusata
- Littorina mariae
Evolution of Littorina littoralis the flat Periwinkle:
It can be difficult to distinguish between the two species of flat Periwinkles. Out on the field old yellow ones could be mistaken for baby green ones. It is however evident that the two species live in a different niche, and populate different habitats. Olive greens L. obtusata on the middle shore and a few on the lower shore and L. mariae on the lower shore only.
The dwarf yellow flat Periwinkle has a shorter life of 18 months compared to the green Periwinkle that lives between 3 and 4 years. This means that L.mariae will not grow so large because it does not live for so long. L.obtusata lives for a considerable longer time and thus can reach a bigger size in its lifetime. This is the main reason for the difference in size between the two flat Periwinkles.
Evolution of body size and life span. The two species fall on either side of the “r-K” continuum. In this case the “r” species is the one that lives for a short period of time, reproduces once and then dies, the L. mariae. The “K” species lives for longer and reproduces a number of times before dying, L. obtusata. Predation pressure is important on the evolution histories. These pressures of predation possibly by shore crabs may have favoured early maturation and increased reproduction efficiency, the snails would have been advantaged if they reproduced before they were predated and killed. It is likely the two species diverged as a result of predation pressure.
Due to the niche of L.mariae it is subject to marine predators that have a long feeding time because being on the lower shore it is under water for the majority of its life. There small size and tough shells mean they have morphed perfectly for their chosen habitat. Large crabs cannot handle the small Periwinkles and by living on the lower shore they avoid contact with most of the small crabs that could eat them if it was possible to crack their thick shells.
L. obtusata can live on the lower shore in F.serratus but are unable to maintain a viable population. This may explain why I only found a few green larger L. obtusata on the F.serratus. Living in their chosen niche, situated on the middle shore reduces the contact with crabs that could crack their thinner shells. This partly explains the choice of habitat and niche by the Periwinkles. They live where they can feed and where their evolutionary changes protect them from predation.
Their colour is an important factor that effects where the different species of flat Periwinkles live. L. obtusata lives on A. nodosum, which is an olive brown seaweed. This means that they are perfectly camouflaged from predators in the air. Predation is a key feature to distribution of animals and the niche they live in. The Abiotic factors in the middle shore are different to those in the lower shore, they spend more time out the water so are under different predator threats and more susceptible to desiccation. The wave action is different and the seaweed they feed on receives different amounts of sunlights.
Ascophyllum nodosum has air bladders, the snail look very much like these air bladders and so are camouflaged.
At first is does not appear that L. mariae display any camouflage with their habitat. However they do. The niche they live in has different Abiotic factors that affect the colour the snails. Being situated on the lower shore they are subject to being submerged under water for 22 hours out of a 24-hour cycle. The predators are thus mainly fish, which swim underneath them. The flat Periwinkles have morphed into yellow colour because viewed from underneath the F. serratus is yellow as the light shines up though it. This means the snails are camouflaged against their main predators. There are a few green L. obtusata on the lower shore they can survive but are not camouflaged under the water so appear as big dark marks on the nearly transparent seaweed.
The lower shore is a suitable niche for L.obtusata but not perfect. I found no yellow L. mariae on the middle shore, I think this is because their bright yellow colour will be obvious to air predators searching the A. nodosum for food, the niche is exposed 12 hours of a 24 hour cycle, the snails do not survive.
What limits the distribution of the species of flat Periwinkles? Experiments have been done in which L. mariae are placed in the middle shore and L. obtusata on the lower shore.
L. mariae did not grow well and population numbers decreased rapidly, probably due to predation and little food. The middle shore consists mostly of Ascophyllum nodosum a tough seaweed that supports little epiphytes, interspecific competition would increase because the food will be scarce, only the fittest and best will survive. Even if they survived this competition aspect there are other disadvantaged included predation from other species and environment of the habitat. The middle shore is exposed 50% of the time, L. mariae are not very tolerant to desiccation and temperature extremes, so this may kill them.
In contrast L. obtusata grow much better on the lower shore. The habitat is suitable. It probably grows faster because of the period of emersion; it is under water for the majority of the cycle and thus has more feeding time. However competition for space and food and limiting factors caused by predation mean that L. obtusata the green flat Periwinkle cannot maintain a successful population in the specific niche found on the lower shore of sheltered shores. The niche at the middle shore with plenty of A. nodosum to feed on and the camouflage the colour of their shells provides combined with the Abiotic factors mean that it is the preferred community.
CONCLUSION:
I disproved my null hypothesis and have looked into the various reasons, which will support my results. As predicted there is a significant difference in the size and colour of flat Periwinkles on a sheltered shore.
Using my data that I collected I used the chi-squared test to show that the distribution of green and yellow flat Periwinkles was very specific, there was a clear zonation pattern. I also used the z test to test the size distribution of flat Periwinkles. Here I also found that there was a clear zonation pattern. Small Periwinkles habited the lower shore, larger ones the middle shore.
In my discussion I looked at the various key factors that could have produced this zonation pattern.
I now summarise:
There are two different species of the flat Periwinkle, L. obtusata and L. mariae. They are different and this is probably due to evolutionary factors of predation.
They evolved to require different niches for survival. L. mariae is especially specific to its niche, not surviving in others, compared to L. obtusata that can survive all over a sheltered shore.
The niche of L. obtusata is on the middle shore and thus 50% exposed so the snails need to be tolerant to temperature fluctuations and desiccation. The main predators are from the air so their olive green colour means they are camouflaged in the olive brown seaweed. There is plenty of A. nodosum to feed and live on without interspecific competition being a major problem. With a longer life span then L. mariae they grow bigger.
The niche of L. mariae being on the lower shore is under water most of the time. This means the main predators are fish and the yellow colour provides good camouflaged. They do not need to be so tolerant to temperature fluctuations of desiccation but to shore crabs; they thus have a thicker shell. They feed on epiphytes, which are plentiful on the lower shore on F. serratus. The size is smaller due to their short life span, probably the effect of previous predation pressure, making reproduction early in life an advantage for the survival of their species.
L. obtusata can survive on the lower shore however their preferred niche is the middle shore so the majority is found there and a few are found on the lower shore.
EVALUATION:
There are no obvious anomalous results in my data. The data in graph 1 shows a normal curve for the size of flat Periwinkles on Fucus serratus on the lower show. The outliers are due to the different species of flat Periwinkles, the L. obtusata, which have a longer life span and thus grow bigger. To clarify the data, graph 3 shows the yellow small L. mariae, graph 4 the larger L. obtusata. I calculated the mean and standard deviation for the size of yellow and green Periwinkles on F. serratus and determined that it was relatively small at 2.00.
The yellow sd is 1.55. Fucus serratus is the main habitat. The curve is slightly skewed but still shows the features of a normal curve, which is expected.
The green sd is 3.76. Fucus serratus is not the main habitat and I think this justifies why the standard deviation is larger and the curve is more distributed. However it is still a normal curve.
My data from the A. nodosum sample also shows a normal curve that is skewed. However there are no outliers and the standard deviation is low at 2.11.
The accuracy of my results was limited in a various number of ways. The callipers were only accurate to the nearest mm and where fiddly to use on the small snails. Digital callipers would have been more accurate to use and quicker. Time was another limitation. If more time was available I could have collected, measured and counted more snails increasing the reliability of my results. I could have done more quadrats on the two stations.
It is unlikely that I collected every single snail in the quadrat; I may have missed a number of smaller yellow ones for example. To try and over come this problem I covered the quadrat in a systematic way to avoid missing patches and I lay low on the ground so that my eyes were close to the seaweed as to not miss the snails. This is a main source of error but is unlikely to significantly affect the reliability of my experiment as I collected a relatively large data sample.
I carried out my chi-squared test at 99% certainty which is as accurate as you can get and the z test at 95% certainty, which is also very accurate.
Also the results I obtained are supported by other people’s scientific experiments.
This makes me believe that the experiment I performed is repeatable.