Investigation into how light intensity affects the rate of photosynthesis.
Investigation into how light intensity
affects the rate of photosynthesis.
Background information
Photosynthesis: Photosynthesis is the process that plants use to convert available chemicals into compounds used as food. It is the most important endothermic reaction on earth for life to exist. Although photosynthesis consists of a series of reactions, this is the overall equation:
(light)
Carbon dioxide + water ? glucose + oxygen
6CO2 + 6H2O ? C6H12O6 + 6O2
Carbon dioxide from the air is absorbed within the air spaces in the leaf, having entered through the stoma, tiny pores in the leaf. Water is taken in by the roots by osmosis, and light is absorbed by the green pigment in the leaves called chlorophyll. The carbon dioxide and the water is converted to glucose, which is used by the plant in various forms or stored as starch, while oxygen gas is released though the stoma.
Photosynthesis occurs in two stages; the 'light dependent process' (light reactions) and the 'light independent process' (dark reactions). The light reactions use the direct energy of the light absorbed to create 'energy carrier molecules' which are then used to form covalent bonds of carbohydrates (glucose) in the dark reactions. All of these reactions take place in the chloroplasts in the leaves.
In the light reactions, the energy form the light produces ATP and NADPH through a series of reactions of electrons, an electron transport process, and water is split into H+ and O- ions. The oxygen is released as gas, and the ATP, NADPH and hydrogen are used in the dark reactions, along with the carbon dioxide.
The dark reactions do not depend as much on light, although it is thought that the enzyme(s) needed to trigger them are triggered by light. The H+ ions combine in a series of carbon fixing reactions with the CO2 in the cells of the leaf, powered by the energy compounds ATP and NADPH. This forms PGAL, and then two of these molecules can combine to form glucose, C6H12O6. We know from scientific experiments tagging O2 molecules by using a different isotopes that the oxygen release is definitely from the H2O.
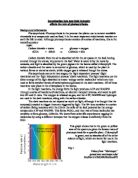
This graph shows that in the green to yellow
area of the spectrum gives the lowest rates of
photosynthesis for a specific plant. Chlorophyll
is green, and so absorbs all of the other
colours of light, which are better for use in the
light reactions.
Fig 1
Taken from "Maricopa" gened.emc.maricopa.edu/
bio/bio181/BIOBK/BioBookPS
Limiting factors: Because photosynthesis depends on a series of reactions, it also depends on many factors, and so the rate of photosynthesis is limited by the factor which is nearest to its lowest value. The reason is because, for example, if a plant only has a certain amount of CO2, it cannot photosynthesise the amount that uses up that CO2. If the amount of CO2 were to increase, then the rate of photosynthesis would increase. CO2 is still the limiting factor. However, if you were to increase the CO2 available too much, then the light intensity may become the limiting factor, as the plant can only photosynthesise as long as it absorbs enough light energy.
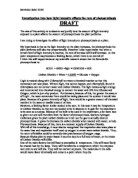
Fig. 2 taken from
BBC Bitesize
This graph shows how the rate of photosynthesis can only increase as much as the carbon dioxide concentration will allow. Carbon dioxide concentration becomes the limiting factor.
Limiting factor is carbon dioxide; light intensity
no longer controls rate of photosynthesis.
Light intensity is the limiting
factor, and controls rate of photosynthesis.
Limiting
Factor
Why it is important to photosynthesis
Carbon dioxide concentration
CO2 is used in the dark reactions as a component of glucose.
Light intensity
...
This is a preview of the whole essay
Fig. 2 taken from
BBC Bitesize
This graph shows how the rate of photosynthesis can only increase as much as the carbon dioxide concentration will allow. Carbon dioxide concentration becomes the limiting factor.
Limiting factor is carbon dioxide; light intensity
no longer controls rate of photosynthesis.
Light intensity is the limiting
factor, and controls rate of photosynthesis.
Limiting
Factor
Why it is important to photosynthesis
Carbon dioxide concentration
CO2 is used in the dark reactions as a component of glucose.
Light intensity
ATP and NADPH, which fuel the reaction to form glucose are formed using light energy.
Temperature
Enzymes that catalyse many of the reactions are affected by temperature.
Fig. 4, limiting factors of photosynthesis.
Introduction
I am going to be investigating into the specific effects of light intensity on the rate of photosynthesis . I will be using the pondweed, Elodea Canadensis, a plant with green leaves that grows in fresh water and reproduces by asexual reproduction. I plan to measure the rate of photosynthesis by finding out how much gas is given off by the plant at different light intensities.
Elodea Canadensis.
This plant is ideal, it has a large surface area to absorb light, and many leaves, and since it photosynthesises underwater I will be able to count the number of bubbles of gas given off.
Light intensity is one of the limiting factors of photosynthesis as the light energy absorbed by the plant fuels the process. I will vary the light intensity as accurately as possible, and record the rates of photosynthesis. I will not be able to measure the rate of photosynthesis as a unit, but I will be able to show how it varies from my results. Also, I can not measure light intensity in units, but I will be measuring the rate of photosynthesis against the distance between a lamp and the plant, so I can plot rate of photosynthesis against light intensity by using the formula light intensity = 1 / d squared.
With these results, I will then be able to establish how light intensity affects the rate of photosynthesis.
Factors
Structural factors:
* Leaf surface area
* Chlorophyll concentration
* Stomatal number and size
* Leaf thickness.
I am only investigating into environmental, or external factors, so I can keep all of these factors constant by using the same plant throughout the experiment.
External factors:
* Light intensity
* Temperature
* Carbon dioxide concentration
All three of these are possible limiting factors, see figure 4. Of these, I am only concerned with light intensity, so I will try to keep the other two factors constant.
Key factors:
Independent variable: Light intensity
Dependent variable: Rate of photosynthesis
Fair test:
To keep a fair test I will have to hold all the factors listed above (except the key factors) constant, and make sure that I can accurately control the independent variable. All of the factors related to the plant itself (structural factors) can be controlled by using the same piece of elodea to collect my results. Leaf surface area, chlorophyll concentration, stomatal number and size and leaf thickness would all allow for a faster rate of photosynthesis, so only if they are kept constant can I produce reliable results.
The rate of photosynthesis will take a few minutes to adjust to the new environment, because the process of photosynthesis consists of multiple stages, and would even continue in the dark (although not the release of oxygen, see background information). For this reason, at each level of light intensity I will wait for at least 3 minutes before beginning to measure the rate of photosynthesis.
The temperature should not be too hard to keep constant, but it is important if I am going to collect accurate data. If the temperature is higher, the enzymes which act as catalysts to photosynthesis would function more efficiently, and so the rate of photosynthesis would increase. If I keep the boiling tube with the elodea in in a beaker full of water then the temperature change should be minimised, as it would take a much greater external temperature change to change the temperature of a beaker of water. The water level in the beaker should be lower than the top of the boiling tube so that the water does not mix, affecting the CO2 concentration of the water in the boiling tube.
The carbon dioxide concentration should be as high as possible to try to prevent it from being a limiting factor. In a natural environment the water would contain very little carbon dioxide, so if I use 50% carbonated water it should not be a limiting factor. I will use the same water for each reading to keep the concentration of CO2 constant. Although the plant will use some of the carbon dioxide in the water in photosynthesis, so there will be a slightly lower concentration for later readings, it should not affect my results as there will be an excess of CO2. From past experience I know that this level of carbon dioxide concentration is high enough to supply the elodea with CO2 but low enough that I will still be able to count the number of bubbles.
The light intensity will not be completely accurate, as there will definitely be some light present in the laboratory, but to minimise this I will conduct the experiment with the lights off and the curtains closed.
Method
Set up the apparatus as shown. Use a piece of elodea with the stem sliced obliquely. Make sure that it is firmly in place with a paper clip, upside down in the boiling tube, as leaves have a greater number of stomata on the underside of their leaves, so gas will be released more readily. Turn off the room lights and cut off any other major light source, so that the light intensity is entirely controlled. Turn on the lamp, and leave it on for 3 minutes before starting measurements. Measure the distance from the plant to the light source as shown.
Carefully count the number of bubbles of oxygen in one minute, timed carefully. Record the measurement d and the number of bubbles in a minute, as well as the temperature of the water. Repeat the experiment, varying only the distance d. To get more accurate results, repeat each distance twice, and take an average.
Preliminary experiment
distance
d (cm)
Bubbles per minute
Set1 Set2
Temperature
(degrees C)
Light intensity (1/d^2)
42
39
20
2
0
39
36
20
0.01
3
20
31
31
20
0.0025
4
30
27
26
20
0.00111
5
40
0
2
20
0.000625
I conducted a preliminary experiment to test how the amount of carbonated water affects the rate of photosynthesis, by trying the experiment as above but with 100% carbonated water. I followed exactly the same method. These are the results I obtained.
The results clearly show a curve, steeper at first, then levelling out, to about 40.5 bubbles per minute, if you include the reading at a light intensity of 1. I found, when I conducted this experiment, that there were too many bubbles of CO2 from the water for me to make an accurate count. This aided in my decision to use 50% carbonated water, 50% tap water.
Prediction
I have accounted for the three main limiting factors: Temperature, carbon dioxide concentration and light intensity. In my preliminary experiment, at lower light intensities the light intensity is definitely the limiting factor, as the rate of photosynthesis changes with it. However, at about 40.5 bubbles per minute the readings of my preliminary experiment levelled off, showing another limiting factor, which I believe to be the only possible limiting factor not in abundance, namely temperature.
Because of this, I predict that when I conduct my experiment, the rate of photosynthesis will increase with increasing light intensity, steeply at first, then levelling off at a specific rate of photosynthesis, in accordance with the law of limiting factors, i.e. another factor will, at some point, become the limiting factor.
Number and range of observations
I am going to keep the number and range of observations that I used for my first experiment, the first at 1cm, then at 10cm, then three more at 10cm intervals. The reason for measuring 1cm, not 0cm is that I cannot obtain a reading for light intensity from 0cm, as 1 / 0^2 is equal to infinity. I feel that this range of observations gave a satisfactory graph in my preliminary experiment from which I could obtain a fairly firm conclusion.
Distance d
(cm)
Bubbles per minute
Set1 Set 2
Temperature
(?C)
40
40
23
2
0
20
25
23
3
20
8
6
22.5
4
30
6
3
22.5
5
40
22.5
Results
Analysis
Although the results were fairly scattered, none of them appeared completely anomalous, and there was definitely a curve to the results, in the shape that I predicted. There is a definite positive correlation between the rate of photosynthesis and the light intensity, as the line of best fit shows.
It is clear from the graph that if the trend from the lower light intensities continued then at a light intensity of 1 (10,000 *10^-4) there would be hundreds of bubbles a minute, a very high rate of photosynthesis. Yet at a light intensity of 1 my results say that the rate of photosynthesis is 40 bubbles per minute. This suggests that there is definitely another limiting factor preventing the rate of photosynthesis increasing further.
These results agree entirely with my preliminary work and also my hypothesis that when I conducted my experiment, the rate of photosynthesis would increase with increasing light intensity, steeply at first, then levelling off at a specific rate of photosynthesis, in accordance with the law of limiting factors.
It is not definite whether the limiting factor in each experiment was the temperature or the carbon dioxide concentration, but I believe that it was the temperature in both cases. Although the main limiting factor for photosynthesis of plants in England is CO2 concentration, I had much higher than normal levels of carbon dioxide in my experiment.
Evaluation
Since I did not record observations at smaller intervals, there are a few things I cannot be sure of. On both my final graph and the graph of my preliminary work, the curve appears to meet the x-axis at about 0.0005 light intensity. This may mean that I have anomalous results, and that that is my margin of error, or it could mean that photosynthesis requires that amount of light energy before it starts to occur, meaning that the light dependent process required that specific amount of light intensity in order to excite the electrons. Unfortunately, I cannot draw a conclusion from this without conducting more investigations, with much smaller ranges of observations.
I was unable to keep the temperature completely constant in my main experiment, and because of that there is a possibility that the rates of photosynthesis towards the right hand side of the graph should be higher, but were reduced by the enzymes not acting as efficiently due to lower temperatures. If I were to conduct the experiment again I would take many more observations, and so I could plot them at regular intervals on a graph I would measure rate of photosynthesis at intervals of light intensity.
I am not able to discern the limiting factor with this experiment, and there is a good chance that the limiting factor changed from my preliminary experiment to my main experiment. The temperature was lower in the preliminary experiment and the carbon dioxide level was double what it was for the main experiment. This means it is possible that for the preliminary experiment the temperature limited the rate of photosynthesis, while for the main experiment the limiting factor was carbon dioxide concentration. I would have to carry out extensive experiments with the temperature and then the carbon dioxide concentration as the independent factor to find this out.
With my experiment, I was able to establish a positive trend, on a curve. However, my observations were too few and possibly too inaccurate to establish the shape of the curve. I was able to find the level at which the rate of photosynthesis stopped increasing with a specific piece of elodea and an unknown limiting factor.
Sources:
* Worksheets on limiting factors
* www.scienceatclifton.com
* gened.emc.Maricopa.edu
* BBC Bitesize
* www.borg.com/~lubehawk/photochm
* Longman Co-ordinated science- Biology