Analysis:
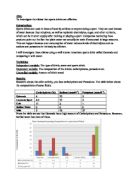
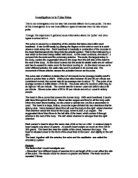
Water hydrates better than any other liquid. Sports drinks do not hydrate better than water, but you are more likely to drink larger volumes, which leads to better hydration. You can get a carbohydrate boost from sports drinks, in addition to electrolytes.
Sports drinks can be helpful to athletes who exercise a lot. The fluids that are supplying 60 to 100 calories per 8 ounces helps to supply the chemicals required. It is not necessary to replace losses of sodium, potassium during exercise since you are unlikely to reduce these mineral in small amounts of training. However, if you exercise in a lot over 3 or 5 hours you will need to add a sports drink with electrolytes. Athletes who do not consume electrolytes under these conditions risk over hydration. When athletes drink excessive amounts of electrolyte free water, they develop low blood sodium concentration.
Conclusion:
Consuming water under normal conditions is better because it does not add calories or unnecessary chemicals, but under high training conditions people should replace the loss of potassium, carbohydrates and sodium with an energy drink. Therefore sports drinks (Gatorade) are effective in high training conditions.
Variables
Independent Variable – The variable that you have decided to change in an investigation e.g. the temperature of the enzyme in an investigation to find out the effect of temperature on enzyme activity
Dependant Variable – The variable that you are measuring as a result of changing the independent variable e.g. the volume of CO2 produced
Categoric Variable – One that is best described by a label (name), e.g. Colour of eyes is categoric.
Discrete Variable – A variable with whole numbers e.g. number of leaves on a plant
Ordered Variable – When you can order the data but not give it an actual number e.g. Height of plants / plants growing in the woodland are taller than those in on the open field
Continuous Variable – One that we measure. Its value can be any number. E.g. temperature as measured by a thermometer.
Control Variable – Variables that may change your results so they should be kept the same e.g. concentration of the enzyme in an investigation of the effect of temperature.
Accuracy – An accurate measurement is close to the true value
Anomalous – A measurement that is well away from the pattern shown by other results
Association – When two variables change together, but they are both linked by a third variable e.g. lack of CO2 in soil and poor growth of plants: both could be link to too much water in the soil
Bar Chart – used when the independent variable is categoric and the dependant variable is continuous
Casual link – When one variable has caused a change in the other e.g. the more plants there are in a pond, the more oxygen there is in the water.
Chance – where there is no scientific link between the two variables e.g. increased sea temperature and increased diabetes
Conclusion – A conclusion considers the results and states how those results match the hypothesis.
Controlled – When your experiment is controlled, all the variables that might affect your result have been kept constant
Control Groups – Used when there are a large number of control variables that can’t be kept constant e.g. when testing a drug on thousands of different people, half will be given the drug and the other half will be given a placebo
Data – Measurements or observations of a variable.
Evidence – Scientific evidence should be reliable and valid. It can take many forms. It could be an observation, a measurement or data that somebody else has obtained
Fair Test – Only the independent variable is affecting your dependant variable, all other variables are kept the same.
Hypothesis – Using a theory to suggest explanations for observations.
Line Graph – Used when the independent variable and the dependant variables are both continuous.
Model – A description of a theory or theories that can suggest further ideas that can test those theories.
Precision – Where your repeated results are very close to each other. This is related to the smallest scale division on the measuring instrument used.
Random Error – Most likely to occur when a poor measurement has been made. It could also be if you have not carried out the method consistently
Reliable – When you make sure other are able to get the same results as you, this makes your experiment reliable.
Systematic Error – If the data is inaccurate in a constant way e.g. all results are 10mm more than they should be. This is often due to the method being routinely wrong
Valid – Describes an investigation that successfully gathers the data needed to answer the original question.
Valid Data – Evidence that can be reproduced by others and answers all the original questions.
Zero Error – A systematic error, often due to the measuring instrument having an incorrect zero. E.g. forgetting that the end of the ruler is not at zero.