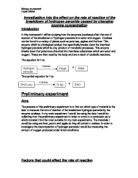
Figure 1.2
If substrate amount rate of x
is not kept in excess then product
product formation will stop formation
as soon as the immediate
substrate has been converted
to product. Enzyme concentration
X = the point where the substrate
runs out.
Product formation will continue at a proportionate rate when there is excess substrate as all the enzyme active sites are constantly occupied. The product formation rate suddenly drops off when substrate runs out leaving the active sites empty with no substrate to convert.
Apparatus
Figure 1.4
Shows the apparatus
used the practical.
(Apparatus cont.)
Table 1.5
The following is a comprehensive list of all the apparatus, equipment and chemicals used for the experiment.
Method
- All the relevant apparatus were collected prior to the experiment to avoid wasting time during the experiment looking for equipment. The cork borer was used to take a 1cm-diameter cylinder out of the full width of the potato. The edges, containing the skin were trimmed, and the potato was cut into four 1cm x 0.2cm cylinders using the scalpel and ruler. 5cm³ of hydrogen peroxide was measured, twice, into a boiling tube giving a total of 10cm³. The pipette sucker and a 5cm³ pipette was used for this, Being careful to measure the hydrogen peroxide correctly, because of the slight concave nature of the liquid at the top
of the pipette. The potato discs were put into the hydrogen peroxide. The boiling tube was then sealed with a bung containing a delivery tube, ensuring there was an air tight seal. This was done by slightly wetting the bung first. The other end of the delivery tube was placed into a boiling tube of water, making sure that the end was submerged under water. As soon as the potato discs were put into the hydrogen peroxide the stop clock was started. After thirty seconds the ticker counter was used to measure the bubbles of oxygen gas given off. This was done for four minutes. The results were recorded.
- After the four minutes were up the used contents, hydrogen peroxide and potato discs were thrown into the disposal beaker. This was emptied after all the experiments were completed. The boiling tube was rinsed thoroughly ready for the next experiment.
- The second experiment was performed exactly the same except for using eight 1cm x 0.2cm potato discs.
- The following experiments twelve 1cm x 0.2cm discs, sixteen 1cm x 0.2cm discs and twenty 1cm x 0.2cm discs were done by exactly the same method.
- After the first five disc size experiments were completed all five experiments were ran again to enable to check if there may have been any anomalous results and to be able to take an average of the results.
- A control experiment was performed to test if it was the enzymes that were reacting and not the hydrogen peroxide reacting with anything else.
The control experiment was done by cutting four 1cm x 0.2cm potato discs and boil them in a beaker over a Bunsen burner for 3 minutes. This was done to ensure that all the enzymes had been denatured and would not be able to function. The enzymes denature because the heat from the boiling water causes the atoms that make up the enzyme molecules to vibrate. This vibration causes the chemical bonds to break and the enzyme looses its shape. When the tertiary shape is lost the active site is altered so no substrate can be converted.
The four boiled potato discs were put into 10cm³ of hydrogen peroxide and the test was run as before. The results were recorded.
Results.
Table 1.6 shows the rough data given from the experiments.
Graph 1.7 shows the results from the first batch of tests. There is a rise in product formation as enzyme concentration increases, although twelve, sixteen and twenty are not proportionate to each other. With four potato discs thirty-nine bubbles were given of; this rises to two hundred & forty-six bubbles with twenty discs.
Graph 1.8 shows the results from the second batch of tests. With four discs it gave off 31 bubbles increasing to 156 bubbles with twenty discs.
Graph 1.8 Effect of increasing enzyme concentrations.
Batch 2.
Graph 2.0 shows an average of the two separate rounds of tests. The average figures should show a more accurate representation of what the data should read if everything during the experiment had been kept at an exact constant, with no abnormalities, except the independent variables.
Graph 2.0 Effect of increasing enzyme concentration.
An average taken from test batches one and two.
The numbers of bubbles given off in the first round of tests were all higher than the second round of tests. With four potato discs, round one gave off thirty-nine bubbles but the second round gave only thirty-one bubbles. With twelve potato discs round one gave one hundred and five bubbles but round two only gave ninety-two
(results cont.)
bubbles. In the twenty potato disc size test round one gave two hundred and forty-six bubbles and round two gave one hundred and fifty six.
Fifty percent of the result figures were in line with the proportionate rate of product formation to enzyme concentration increase, and the other fifty were out of line with the rest. To be in line I allowed a five-percent tolerance level for the actual figures. This is to allow for the uncertainty of actual bubble gas volume. Of those four figures that were out of the proportionate rate three were higher than the proportionate rate and one was lower.
In round one (see table 2.1) of the tests the twelve disc, sixteen disc and twenty disc results were out of line with the proportionate value. The twelve disc results were lower than the proportionate rate, which was one hundred and seventeen and the actual figure was one hundred and five.
The sixteen disc results were higher than the proportionate rate with one hundred and eighty one bubbles where the actual should have been one hundred and fifty six. The twenty disc results were also higher at actual two hundred and forty six where the proportionate rate should have been one hundred and ninety five.
In round two the only result that was anomalous was the sixteen disc test which gave one hundred and thirty six bubbles were the proportionate rate was one hundred and twenty four (see table 2.2).
The proportionate data is given under the assumption that the data collected from the first test, four potato discs, is correct. If this figure were incorrect then all the proportionate data would be incorrect. But as shown in the graphs and tables the results follow the correct graph gradient with only slight anomalous results.
Table 2.1 first round of tests
Table 2.2 second round of tests
Discussion
Within all the tests I used all the same equipment, so the errors or anomalous results that occurred should all be the same or explainable if it were equipment-based problem and not a human error. This is known as ‘claiming standard error’ for the results.
The results from the tests show that as enzyme concentration increases product formation will also increase, as is show in graphs 1.7 and 1.8.
In the two rounds of tests I did there was a proportionate increase. This is because with the enzymes being in an excess of hydrogen peroxide the active sites of all the enzymes are functioning at their optimum rate. Every active site is being used in reaction so product output is at its highest level possible for the present enzyme concentration level. Enzyme reaction rates may be increased or decreased by other factors such as temperature or pH. During this experiment these were kept at a constant to avoid such rate variations.
I stated in my hypothesis that if there wasn’t an excess of substrate then as soon as all the substrate had been converted into product then the active sites would become empty. This would cause production rates would drop drastically. I predicted this would happen at a point during the experiment. It did not. I believe that if the tests had been run longer then this would have occurred, but as time was a limiting factor in my experiments I was unable to run them for a period of time that would cause that to happen.
As enzyme concentration increases from four discs to eight discs the bubble count increased from thirty-five bubbles to sixty-nine point five. This is zero point five out of the proportional rate. At twelve discs the rate was at ninety eight point five bubbles, slightly lower than the proportional rate. The sixteen and twenty potato
discs were at eighteen point five and twenty-six bubbles, respectively, above the proportional rate.
I believe this was due to the inconsistencies in the size of the potato discs cut. The results above the proportional rate, sixteen and twenty discs, may have been cut slightly larger. This would have increased the surface area for the reaction to take place, giving higher results. The twelve disc test which was lower than the proportional rate may have been cut slightly smaller, making surface area smaller for reactions.
The difference for the values between round one tests and round two tests may have been caused by changing the hydrogen peroxide after the first round of tests were complete. The hydrogen peroxide used for the second round of tests may have been of a slightly weaker concentration or may have come into contact with air or light that may have degraded it.
Conclusion
The data collected from the experiment supports the hypothesis that as enzyme concentration increases then product formation rates will also increase at a proportional rate.
This is shown by the ‘bubbles given off’ data collected, rising at a proportional rate from the first reading of four potato discs to the last of twenty potato discs.
Within the experiment there were four anomalous results which may have weakened the hypothesis. I believe that the hypothesis wasn’t weakened, due to the fact the anomalous results were caused by an explainable human error of inconsistent cutting of the potato discs.
Improvements
Since performing my practical experiment I have had time to consider the experiment procedure and evaluate the work that I did.
I believe that the experiment method and apparatus worked correctly and achieved the results that were needed to progress with the hypothesis.
Upon evaluation of the practical I would alter several thing if I were to perform the tests again.
- Run the test for longer and for a higher range of enzyme concentrations. This would have enabled me to find the production drop of point when the substrate runs out.
-
Measure the actual output of oxygen in cm³. Not all the oxygen bubbles given off will have been the same size. Counting the bubbles is an acceptable method within the time I was allocated but for more precise results the O₂ output could be measured using a gas cylinder with a water displacement procedure or a set up of apparatus were a glass syringe was used to measure the O₂ output.
- Temperature controls of the hydrogen peroxide so all the tests are performed at a constant temperature. If there was any variation in temperature from test to test then the test with the warmer solution might have increased results due to the extra kinetic activity the increased heat would cause.
- Temperature control of the potato. If there were any areas of the potato which were warmer than others then they might be prone to a accelerated rate of denature of decomposition from a cooler area. This might lead to anomalous results because of uneven enzyme distribution.
-
Whilst the tests were being run I noticed that the potato discs all floated to the top of the hydrogen peroxide solution. This might have effected the results by some areas of the enzyme not being in any contact with the substrate. To alleviate this problem a shaker could be included to the apparatus to gently rock the test tube holding the H₂O₂ and catalase to ensure constant circulation of the products.
- Replacing the potato discs with an homogenate of potato or by using a liquid catalase. Cutting the potato discs 1cm x 0.2cm is a little too precise with a scalpel and ruler, and is prone to irregular cutting, which may cause anomalous results by having a different surface areas from discs to discs, batch to batch.
- When measuring the 10cm³ of hydrogen peroxide out into the test tube I used a 5cm³ twice. It would be more accurate to use a 10cm³ pipette or cylinder.
- During the practical I put the hydrogen peroxide into the test tube first then cut the potato. This would be altered to putting the potato in first, as hydrogen peroxide is susceptible to degradation by air and sunlight. This may have weakened the solution and caused anomalous results.
References
Within this practical write up there are no direct quotes from any textbook or information resource. The following is a list of the information resources I used for research into this topic.
A new introduction to biology – AS level –2000 - Bill Rudge, Martin Rowland &
Margaret Baker.
Advanced biology –1984 - J.Simpkins & J.I.Williams
Microsoft Encarta encyclopaedia 99
Essaybank.co.uk