(Light)
Water + carbon dioxide ----> oxygen + glucose (stored as starch)
(Chlorophyll)
Light energy is one of the most important parts of the equation because without the light energy photosynthesis cannot take place. Both light and chlorophyll are needed for photosynthesis but they are not part of the reaction and are not used up.
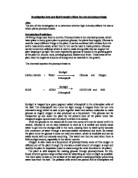
Method
- To measure the rate of photosynthesis I will place a measuring cylinder over an under water plant (Elodea). As the water level decreases I will be able to measure the oxygen produced at the top of the cylinder. I will increase the light intensity by moving the lamp away from the plant from 10 cm to 100 cm away, and measure how much oxygen is produced each time. I will repeat this three times to make sure it is fair and the results are reliable.
- Too make sure it is a fair test I need to try and keep the temperature and amount of carbon dioxide constant so the results are accurate.
- Safety. I will make sure that the tank of water is not near any electrical appliances. I will also make sure the area around the experiment is clear and that there is nothing dangerous on the floor.
- I will record my results in the following table:
Etc.
Once I have collected all my results I will plot them on this graph to get the rate of photosynthesis, and how it differs when the lamp is moved. I am going to put all the results on one graph so it is easier to compare them and write up an evaluation.
Amount of
Oxygen
Produced
(MM)
Distance of lamp away from beaker
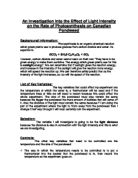
Results
I was unable to conduct the experiment in the laboratory because there was not enough oxygen produced to make the results reliable
To work out the rate of photosynthesis I did Light intensity divided by 10 divided by 60.
This graph shows that as the light intensity percentage increases, so does the volume of oxygen produced.
This graph shows that as the light intensity increases so does the rate at which the Elodea photosynthesises.
Conclusion
As the light intensity is increased the rate of photosynthesis also increase, so my prediction at the beginning of the experiment is correct. I also predicted that the rate of photosynthesis would come to its highest point and then level out.
This is because the plant has plenty of light but it will eventually run out of carbon dioxide to photosynthesise any more. This theory also includes temperature and light, along with carbon dioxide they are the “limiting factors” of Photosynthesis. My graph did not level out because it always had plenty of carbon dioxide.
Evaluation
To evaluate my experiment I would say that it went well, but would have liked to carry out the experiment instead of using the computers. In my results table I found I needed to add an extra column entitled “rate of photosynthesis” so I was able to use that information later in my graphs. I also found it easier to use two graphs instead of one, as I used ICT to make my graphs.