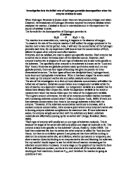
Below is a graph to illustrate the trend described above:
Variables:
In this test, the independent variable which is tested is the concentration of the substrate H2O2. The hydrogen peroxide (aq) provided for this experiment is around 1.50mol dm-3 in concentration. For me to be able to vary the concentration of the substrate, I will have to add distilled water to it.
For the purpose of this experiment, the H2O2 solution provided for us will be considered to be 100% H2O2.
To be able to establish a trend for the experiment, at least 5 different concentration of the substrate has to be used. Since we know the range of substrate concentration available to us is 0 – 100%, it would be sensible to test concentrations of H2O2 of every 20%. Therefore, readings at 20%, 40%, 60%, 80%, and 100% will be taken.
It is obvious that no decomposition of H2O2 will occur when its concentration is 0%, so we can assume that the reaction rate will be 0 also.
It seems that a total volume of 50cm3 is a good amount for the volume of the substrate solution to use. This would mean enough H2O2 will be present for reaction at the smallest concentration and that not too much oxygen will be produced when a high concentration is used. Its relatively large volume can also be measured with a measuring cylinder giving a small degree of precision error.
Control variables
To be able to determine the true effects of substrate concentration on the rate of reaction, other variables which will also affect the rate of reaction has to remain constant. Below is a list of variables which all affect the rate of catalysed reaction. I have included brief explanations of why they will affect the rate of reaction and how they will be controlled for the purpose of fair testing.
Catalase concentration: Similar rules apply for the enzyme concentration as those for substrate concentration. As more enzymes are present due to a higher enzyme concentration, there are more active sites available for the H2O2 molecules to bind to. Therefore the initial rate of reaction increases proportionally with the concentration of catalase. When the number of enzymes available exceeds the number of substrate molecules available, the rate of reaction will remain constant even though more enzymes are present.
In this experiment, this variable controlled by adding the same amount of potato for each reaction. The potatoes are cut into cylinders of identical diameter and length. This means that the surface area of the catalase containing potato exposed to the substrate remains constant. The number of potato cylinders to use for each reaction has to be determined by a preliminary experiment
Temperature: Owning to the 1st law of thermo dynamics, as the thermo energy of the solution increases, so will the kinetic energy possessed by the enzyme and substrate molecules. As the temperature increases, the catalase and H2O2 molecules move faster than before. This leads to more collisions between the two so more reactions take place. So the reaction rate increases as the temperature is increased. Up to 40oC, the rate of an enzyme-catalysed reaction doubles for each 10oC temperature rise, this is known as Q10. (Toole A., Toole S., 1988, A-level Biology Course Companion, Charles Letts and Co.)
As the temperature increases further, the rate of reaction will begin to decrease. This is due to the fact that the structure of enzymes is maintained by hydrogen bonds. As the temperature increases, the hydrogen bonds are broken. This completely alters the shapes of the active sites of the enzymes, the result of which is that the enzyme can no longer aid any reaction. At around 60oC, the enzymes are completely denatured, so no reaction will take place.
In this experiment, the temperature of the reactants should be maintained at the same level for every test. Although it seems that 40oC is a suitable temperature since here the reaction rate will be at its optimum, a temperature closer to room temperature will be much easier to keep constant. If the solution of H2O2 is allowed to equilibrate with the room temperature of ~25oC before being used, a constant starting temperature can be achieved. A water bath of room temperature will also be used to maintain the temperature through out the reaction. It will neutralize any temperature change caused by the exothermic nature of the reaction.
Time: As more time is allowed to elapse for the reaction to occur, it is obvious that more O2 will be produced. Therefore, to establish a rate of reaction, the time for which the reaction is allowed to occur must be kept constant.
Given the turn over rate of catalase is 5,000,000 , an relatively short period of 60sec would be adequate for enough O2 to be produced to calculate an accurate rate of reaction.
In this experiment, the catalase induced reaction is therefore allowed to occur for 60sec, the amount of oxygen produced after this long can therefore for be recorded for the calculation of the rate of reaction.
Other variables which usually affect the rate of enzyme-controlled reactions include the pH of the solution (low pH denatures enzymes due to the presence of H+ ions) and the concentration of inhibitors of catalase (presence of inhibitors restrict the reaction rate). These need not be actively controlled here since:
- The pH of the solution will not change as reactions take place.
- No inhibitors will be present in the solution in the first place
Having said the above, a pH of around 7.6 should be maintained for the solution before the reaction is started since this is the optimum pH for catalase catalysed reactions. (Green, Stout, Taylor, 1984, Biological Sciences,). In other words, the H2O2 solution has to be roughly neutral.
Independent Variable
This will be the amount of O2 produced due to the concentration of substrate molecules present. A reaction rate in the form of cm3 of O2 per minute can be calculated from this
Plan
Apparatus:
To measure the amount of oxygen produced, I could use:
Up turned measuring cylinder: It will have to be completely filled with water. As oxygen is collected in it, the water is displaced and the receding water level will tell us the volume of oxygen produced.
Up turned burette: This will be used in the exact same way as an up turned measuring cylinder. This advantage this will have over the measuring cylinder is that it will measure to ±0.1cm3, giving an accuracy ten times that of the measuring cylinder.
Bubble counting with up turned boiling tube: An up turned water filled boiling tube could be used for oxygen to be collected in it. Since oxygen is given off in the form of bubbles, the number of bubbles given off could be used to calculate the reaction rate. A boiling tube is preferred to a normal test tube due to its larger volume.
Gas syringe: This is a syringe especially adapted so that it self fills as gases (often under low pressures) enters it. It will be able to record the amount of oxygen given off by our reaction to a suitable degree of accuracy.
I have decided to use the gas syringe to determine the amount of oxygen produced. This decision was made because:
- The test tube method will not give us definite quantitative results. Unlike the other methods, the volume of the oxygen produced is unknown. It will also be hard to count the number of bubbles given off if the reaction rate is particularly high.
- All of the methods of using the displacing of water to measure the amount oxygen produced are sound in theory. In practical, however, they will be far more time consuming to be set up. For example, to reset the syringe to a reading of 0 all that has to be done is for me to push back its plunger. On the other hand, the burette/measuring cylinder will have to be refilled with water and carefully turned upside down under water, this is a far more time consuming technique. Additional equipments will also be needed to employ these methods, e.g. a water bath.
- An air syringe when set up properly will give accurate, quantitative results with out much effort and time.
For the vessel in which the reaction will take place, I could use:
Beaker: This is available in a range of sizes. It allows suitable amounts of solution to be added into it to react. Making sure that all of the gas produced by the reaction is collected in to a gas syringe will be difficult with this since it has a very large opening and a grooved mouth for easy pouring.
Conical flask: This is also off suitable size for the 50cm3 of H2O2 solution to be added. Its narrow neck lends itself perfectly to be covered by a rubber bun so that no gas escapes unmeasured. The bun will have to be specially adapted though with a capillary tube inserted in it so that the oxygen produced can be collected for the gas syringe.
Boiling tube: Although this is often used as a vessel for reaction, its volume will not be adequate for the tests I will be conducting.
Buckner Flask: This is exactly the same as the conical flask apart from that on the neck of the flask a piece of glass tubing is already attached. This will allow the gas syringe to be connected via a length of rubber pipe of a suitable diameter. A normal rubber bun could then be used to seal the opening of the flask.
I have decided to use the Buckner flask contain the H2O2 solution and enzyme during the reaction. This decision is made upon the reasons below:
1. Unlike other types of apparatus, the Buckner flask allows a rubber tubing to be connected from it to a gas syringe without further adaptations.
2. Its narrow neck allows it to be sealed easily with a rubber bun.
3. It is of suitable volume to contain the reacting substrate and enzyme.
There is not a great range of equipment that could be used for the following tasks, instead of listing alternative equipment I will simply state the equipment selected and a reason for its selection:
Cutting of potato pieces into size:
Apple corer: This is perfect in creating cylinders of potato with identical diameters. The cylindrical shape of the potato pieces is preferred due to that it will provide larger surface area - volume ratio for each piece of potato. This will mean that more catalase will be accessible to the substrate molecules.
30cm Ruler: The potato cylinders will have to be 0.5cm long, a ruler which measures ±0.5mm is accurate enough to give a reliable length of potato cylinder.
Scalpel: This is used carefully to cut the cylinders to their desired length.
To maintain the temperature of the solution, a water bath and a thermometer will have to be used.
Thermometer: This should be inserted in to Buckner flask to determine when the required starting temperature is reached by the H2O2 solution. It is only after the desired temperature is reached that the potato pieces are added. Another thermometer should be placed in the water bath to monitor its temperature.
Water bath: This could in the form of any container that can be filled by a large amount of water. The Buckner flask will be immersed in this.
To time the reaction
A digital stop watch will be needed to time the reaction accurately so that the volume of oxygen produced after 60sec can be recorded. Alternatively, a count down timer could be used. The significance of which of the two is used is not great in the context of this experiment.
To make up H2O2 solution of the correct concentration:
100cm3 measuring cylinder: This is used to measure out the desired amounts of H2O2 and water so that they can be mixed together to produce a substrate solution of the desired concentration.
A 20vol. (~1.5mol dm-3) H2O2 solution will be used. This is suitable in that it will not be too concentrated since H2O2 is a harmful substance. At the same time enough H2O2 will be present for a noticeable amount of O2 to be produced.
Distilled water is used so that no impurities exist in the solution which may slow down the rate of reaction.
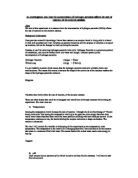
The equipment will be set up as below:
Preliminary experiment
A preliminary experiment was carried out to confirm the validity of the ranges and scales of variables I have chosen in the variables section. Another purpose of the experiment would be to determine a suitable number of potato cylinders to be added into the solution.
Method
- Connect gas syringe to Buckner flask via a rubber tube. As shown in the diagram.
- Use scalpel and apple corer to cut 0.5cm potato cylinders.
-
Measure out correct volume of water and H2O2 and water using measuring cylinders for H2O2 solution of desired concentration.
- Add mixture to Buckner flask and leave in water bath.
- Insert thermometer to obtain the temperature of the solution. Wait until correct starting temperature is reached.
- Add potato cylinders, immediately seal with rubber bun and start stop watch.
-
After 60sec, record the volume of O2 collected in gas syringe.
Method
A final method is devised using results obtained from the preliminary tests. They helped to confirm the following ranges and scales of variables:
-
The solution of H2O2 will be made up to 50cm3. This has proved to be a suitable volume to use.
-
The range and scale of the different concentrations of H2O2 solution will be 0%, 20%, 40%, 60%, 80%, and 100%. Knowing that a solution of 50cm3 will be made up, the following amounts of H2O2 solution and water will be mixed to obtain the different concentrations:
- The starting temperature will be the room temperature since it is easily maintainable and the rate of reaction is not impeded at this temperature.
- Five 0.5cm long potato cylinders will be used. The short length of the potato pieces means that there is a large surface area meaning more catalase molecules are accessible to the substrate molecules. There are enough enzymes present so that products are being produced at a significant rate.
- 60sec is a good time period for the reaction to take place before the volume of oxygen produced is recorded.
Procedure
- Connect a Buckner flask to a gas syringe.
-
Measure out desired amount of H2O2 in a 100cm3 measuring cylinder.
-
Add water to the H2O2 in the measuring cylinder so that the total volume of the solution reaches 50cm3.
- Transfer the content of the measuring cylinder in to the Buckner flask already set up.
- Place the Flask along with its content into a water bath of room temperature. Use a thermometer to test for equilibrium in the temperature of the solution in the flask and the water bath. Wait until the desired temperature is reached and remove the thermometer.
- While the solution is equilibrating in the water bath, prepare 5 cylinders of potato each 0.5cm in length using an apple corer and scalpel.
- When the require temperature is reached, add the potato cylinders prepared into the Buckner flask. Then immediately replace the rubber bun on top of the Buckner flask and start the stop watch. (see diagram)
- When the stop watch reaches 60sec, take the reading of the gas syringe of how much oxygen is produced in this time.
- Record the result in the results table.
- Repeat procedure another two time for this particular concentration and then move on to the next concentration.
Reliability – Fair test
The method devised for this experiment eliminates the effects of other variables on the rate of this enzyme-controlled reaction, this means that reliable results are able to be obtained. Measures taken in the experiment for fair testing include:
- Using the same amount of potato cylinders so the enzyme concentration remains the same.
- Keeping constant the temperature of the solution so it does not affect the reaction rate.
- Recording the volume of oxygen produced after a fixed amount of time.
- Suitable selection of apparatus.
-
It is made sure that as soon as the catalase is added, the rubber bun is placed in the mouth of the Buckner flask. This makes sure as little oxygen escape as possible. The stop watch is only started when the rubber bun is placed so that the volume of O2 recorded is still oxygen produced in 60sec.
In addition to the above, each test for each concentration of H2O2 will be repeated 3 times so an average will be able to be obtained to further enhance the reliability of the results.
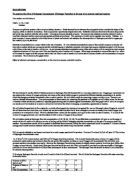
Use of results
The results for each test will be collected in the following table`
*Any clearly anomalous results will be ignored in the taking of an average.
The rate of reaction is measured quantitatively in the form of cm3 of O2 produced per minute. This value can be plotted against the concentration of H2O2 as the variable on the x axis on a graph. The pattern shown by the graph can be characterized with a trend line. From the graph, a relationship between the concentration of the substrate and its reaction rate can be established as well as quantitative analysis for the Michaelis constant (the substrate concentration where the reaction rate is half of Vmax). (M B V Roberts, 1971, Biology a functional approach, Thomas Nelson and Sons Ltd)
Risk Assessment
Care will have to be taken with laboratory glassware. If any glassware is broken, quickly sweep up and put into broken glass bin.
Care should be taken with sharp objects such as the scalpel.
Chemical:
Hazards data obtained from Health and Safety information, BDH.
Bibliography
Villee C., Dethier V., 1970, Biological Principles and Processes, W.B. Saunders Co
M B V Roberts, 1971, Biology a functional approach, Thomas Nelson and Sons Ltd
Jones M., Fosbery R., Taylor D, 2000, Biology 1, Cambridge University Press
Toole A., Toole S., 1988, A-level Biology Course Companion, Charles Letts and Co.