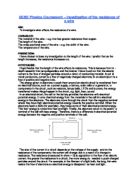
The vertical arrow represents the movement of the electron below it, to an empty outer shell after the photon strikes it.
Note that this movement is continuous. The electron cannot occupy as shell that is already full. To this end, it does not stop as it passes through any of the other shells and if, as in this case the first shells are full, it will fall into a new electron level that was previously empty.
A voltage increase is seen across the LDR when bulbs of increasing Wattage are placed next to it. We can see this in retrospect from the results table and the graph.
However, it is not true to say that the resistance of the LDR is affected by light intensity only.
When light (a photon) strikes the electron, enough energy is transferred to move it to the outer shell, as we have already discussed.
The more photons there are the more electrons will be struck. This means that more electrons are free to carry charge and therefore the voltage increases.
In this way we can see how light intensity can affect the voltage. However, the amount of energy transferred to each electron by a single photon is dependent on the FREQUENCY of the light (multiplied by Planck’s constant).
E=hf
The reason why the voltage increases with light intensity is that the bulbs used in the experiment emitted white light, which contains all frequencies of light.
The electrons in the semi-conductor all responded to the same frequency of light (i.e the amount needed for the electron to transfer to the outer electron level.
Therefore each electron receives the correct amount of energy but the higher amount of electrons means more electrons are freed, which as I have explained increases the overall voltage within the circuit.
These facts (which incidentally I obtained from The Art of Electronics by Horowitz Hill 1980), went a long way to reassure me that my results were accurate.
Imagine we are thinking of a non-quantum explanation for why the voltage across the LDR varies. We assume then, that it is the intensity of these light bulbs solely which will control the resistance of the LDR.
This inaccurate theory taken into account let us then examine two of my results. I obtained an average voltage across the LDR for a 20 Watt bulb of 1.58. For a bulb of 100 Watts I obtained an average reading of 1.92.
Imagine my thinking at the beginning of this experiment. I thought that the voltage across the LDR was directly proportional to the intensity of light falling on it solely.
I performed the method you will read later and then plotted my results table.
Imagine then my confusion when I examined my results. If the voltage reading depended on light intensity solely, why wasn’t the voltage across the 100W roughly 5 times (5*20=100) that of the 20W bulb?
The non-quantum theory I mentioned above had to be discarded, as based upon this explanation, the voltage should double every time the light intensity doubles. The results did not bear this theory out so I realised that there must be another factor which was affecting the voltage across the component.
What was initially a simple and mundane experiment developed into great significance. Either there was a gigantic margin for error (a point I will discuss in my evaluation) or the Quantum explanation I have given for the behaviour of the LDR was true i.e. that the electrons in the semi-conductor were in fact all responding to the same frequency of light, with the same amount of energy, hence the similarity of the readings.
Planning and Method for an Experiment to investigate changes in Resistance of an LDR
Notes:
In this experiment I experiment using various types of resistor, including a 1 Ohm and 30K Ohm component. I found that a 1k Ohm resistor suits my purposes best as lower resistors tend to burn out or give wide-ranging results making the difficult to graph and the voltage changes in larger resistor are to small to measure given that the digital voltmeter is only precise to 3 significant figures.
I initially performed this experiment in the Lab, compensating for the amount of background light by measuring light intensity before turning the bulb on and subtracting this value from the voltage reading after the light was turned on.
However I realised that as there were large windows in the laboratory, the background amount of light would never be the same from one minute to the next. To this end I decided to perform the experiment in a darkroom to minimise any extraneous light so only the light intensity of the bulb in question would be measured.
I realised also that light intensity will naturally vary as the distance between the bulb and the LDR changes. In order to remove this margin of error from the experiment, I placed the clamp directly above the LDR with the bulb facing downwards. The end of the bulb was always 10cm from the LDR.
Method:
- Set up apparatus as shown:
The bulb should be aligned so that it is clamped 0.1m directly above the LDR- this is difficult to represent on the diagram.
- The apparatus must be placed where no other light sources can interfere with the experiment such as in a dark-room.
- Switch on the bulb (initially use a 20W one). Allow 5 seconds before taking a reading. This gives the filament time to fully heat up, so the bulb is at maximum intensity.
- Record the reading on the Voltmeter. Repeat step 3 for bulbs of 40W, 60W and 100W. Record the reading for these also.
- The entire experiment should be repeated twice more in order to ensure consistency in the results.
- Plot a graph of the average of all 3 results.
Results
The highlighted result is the only one I see as anomalous.
See over for graph.
Graph of Various Wattage bulbs against the resistance of an LDR.
While not exactly a straight-line graph (for reasons I shall explain later), we see the general principle that the voltage is increasing with the wattage of the bulbs.
Evaluation
As you can see on the results table, I have highlighted an anomalous result. Assuming that the apparatus was assembled correctly and that I read the results accurately from the Voltmeter, the resistance of the LDR may have been affected by other factors.
Resistance can vary with temperature; in fact it increases as the temperature rises and vice versa.
It may have been that the current flowing through the circuit was sufficient enough to raise the temperature of the resistor, due to the massive number of electrons flowing down such a thin wire.
If this was so, then as the experiment progressed, the resistor would have become hotter, increasing the resistance and therefore biasing the results.
Were I to repeat the experiment again, I would need to make sure the temperature of the circuit was constant to prevent this factor from biasing the results. This could be done by replacing the resistor with another of identical resistance or by allowing one resistor time to cool down between readings.
Furthermore, if the light intensity of the bulbs was not a constant throughout the experiment, this would have also affected the resistance of the LDR.
We must not forget that these light-bulbs were powered from the Mains AC supply, which has an average voltage of 235V.
Depending upon the power consumption on the local grid, the voltage supply may have varied; this would have affected the light intensity.
To solve this problem, a more stable power supply is required.
It is also worth noting that we do not know that all of the light bulbs were emitting the same range of frequencies.
We assume that there is a certain frequency of light which will provide the correct amount of energy for an electron to move from one electron level to another.
We also assume that the light-bulbs all contained this particular frequency of light and all the electrons were responding to it with every single bulb.
This assumption is unsafe. We have no guarantee that the electrons in the LDR were all responding to the same frequency of light.
If the frequency varied, then the amount of energy transferred to the electron would have varied, increasing or decreasing its potential to carry charge.
To solve this problem all the frequency spectrum intensities of the bulbs need to be measured before the experiment to make sure that the spectrum of each bulb was identical.
Conclusion
Through careful examination of the results table, graph and of my explanations, I think we can safely say that the voltage across an LDR will increase when the intensity of light at a certain frequency increases.
This ties in with my initial prediction that the voltage would increase with the wattage of the bulbs.
Had I more time I would like to examine the voltage across the LDR when exposed to lights of different frequencies i.e. all the colours in the spectrum.
Since we know the frequencies of all the colours of light, it would be possible to prove a definitive link between light frequency and the amount of energy transferred.
If we wish to talk about the Quantum aspects of this experiment, this experiment goes a long way to prove that light has particle-like properties as the amount of energy needed to make an electron move from one level to another is fixed and yet the light seems to provide this exact amount every time it falls on the atom.
Essentially, the electrons are receiving a certain amount of energy each time. It could be that every single light ‘wave’ contains an identical amount of energy or it could be true that single photons are delivering an exact ‘packet’ of energy to allow the electrons to become Charge carriers.