The method of deciding when the mixture has turned fully transparent is when you are able to read “homework diary” which is placed behind the boiling tube. This was chosen because it was very effective and only when the mixture fully became transparent the words could be read. Other methods included making your own judgement when the mixture was clear, but this was not very accurate.
Variables
Independent variable:
Dependant variable:
- Time taken for mixture to become transparent
Controlled variables:
- Enzyme temperature
- Volume of milk
- Stirring
- pH
There were controlled variables to ensure there was only one factor that changed and that was the enzyme concentration. If another variable changed for example the enzyme temperature the experiment would become unfair and the results would become invalid.
Reliability
I will make sure my experimental results are reliable by doing three repeats and taking the average.
Accuracy
I will use suitable equipment for measuring volume, for small amounts of milk I will use the 5cm³ syringes and the use of pipettes will not be considered because absorbing water without air bubbles is very difficult and when using measuring cylinders read of the bottom of the meniscus.
Prediction
I predict that when I increase the enzyme concentration, the rate of reaction will increase. This is because there are now more enzyme molecules to link on to the active site, with the same number of substrate molecules. As 5cm³ of casein is always used. This will allow more enzyme-substrate complexes to be formed. Thus breaking down the substrate (casein) faster and producing more products, amino acids. I also predict that when I decrease the enzyme concentration of Trypsin the time taken for the mixture to become transparent will take longer. This is because they are fewer enzymes molecules as the concentration decreases. It takes longer for all the substrate (casein) to reach a “free” active site and to be broken down in products, amino acid. The mixture will then become transparent as amino acids are soluble.
A Table to show how I prepared the range of Trypsin concentrations
Obtaining Evidence
A Table To Show The Relationship Between The Concentration Of Trypsin And Time Taken For The Casein To Turn Transparent
Analysing
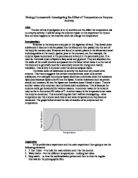
On Graph A there is a negative correlation and therefore a negative gradient of 50/0.2 (250), the Best fit line shows this. The trend is as the concentration increases, the time decreases. This is because as the concentration increases there are more enzymes present, as there is a higher concentration Trypsin than to Water, as the concentration increases. This means that more enzymes are more likely and fit together on the active site with the substrates, i.e. the lock and key theory. With more enzyme-substrate complexes being created more products, i.e. amino acids, are formed at a faster rate.
The trend agrees with my prediction that as the concentration increases, the rate of reaction increases. This means the time taken for the mixture turn transparent decreases, as there are now more enzyme molecules to link on to the active site, with the same number of substrate molecules. At a high concentration of 1.0% Trypsin the average time was 85 seconds. This shows that more enzyme-substrate complexes were formed. Thus breaking down the substrate (casein) faster and producing more products, amino acids, thus turning the mixture transparent. However, at a low concentration of 0.2% Trypsin the average time was 261 seconds. 0.2% of Trypsin produced fewer products (amino acids) and made the mixture transparent 176 seconds slower. The evidence proves that 0.2% Trypsin makes the casein transparent far slower than the 1.0% concentration of Trypsin.
There are no anomalies in my graph and all the points were either on my best fit line or very close to it.
On Graph B there is a positive correlation and therefore a positive gradient, shown by my best fit line. The trend is very similar to Graph A’s; as the concentration increases, the rate of reaction increases. This is the rate of which the enzymes and substrate fit together so the substrate can be broken down by the enzymes and produce a product. Graph B proves that more enzymes produce more collisions and connections at the active site. Therefore more enzyme-substrate complexes are formed and more products at a faster rate.
The trend on Graph B agrees with my prediction that as the concentration increases the rate of reaction also increases. This has been explained many times that there are more enzymes to collide with the substrate and therefore produces more products, i.e. amino acids that are soluble, that turn the milk transparent in a shorter period of time. Graph B proves this, as 0.2% concentration of Trypsin has a lower rate of reaction, of 0.00075 1/sec compared to 1.0% concentration which has 0.01176 1/sec.
There was only one possible anomaly which I have circled and have discussed in my evaluation section.
Evaluation
The data was not exceptionally reliable and could have been made much more reliable if certain aspects of the experiment were altered. The reliability of the data was not extremely reliable as a lot of equipment was not incredibly accurate. The syringes were very difficult to use as they got jammed when trying to obtain a solution e.g. water. They also sucked up air bubbles which were very difficult to exclude, and the most significant problem was ensuring that each time when using the syringe to obtain the exact same volume of solution.
Within the method there were various restrictions, for example the time. We were allowed forty five minutes maximum. This meant we had five minutes to set up and clear away the apparatus, leaving only thirty five minutes to do the experiment. Only five different results added to the repeats were done in two whole periods (90mins), this proved to be a challenge time wise. Another limit was the amount of substrate and enzyme available, as there was a time restriction.
Many improvements could have been made to the method. An alternative to the jammed syringes was to use a burette and acquire the amount of water, casein and the 1% Trypsin. The accuracy of the burette is far better than the small syringe and there would lead to more reliable data. I decided to not shake the test tubes as I would not be able to shake all five tubes with the exact force. Also judging the point of which the mixture turned transparent was very difficult to determine, therefore I suggest placing a white piece of paper with a back printed word behind the test tube. When the word becomes visible and therefore readable, the mixture has turned transparent.
The reliability of data was reasonably good as I only encountered one anomaly which occurred on Graph B and could have been avoided with more replicas. This may have occurred because the period of time that the experiment was completed was split. This concentration could have been experimented on a different day with different sized syringes. The trends on both graphs were as predicted in my planning section. Most of my points on both graphs were very close to my best fit line but for a few points on Graph A 0.2%, 0.5% and 0.6%. on Graph B most of my points were on the best fit line excluding the anomaly, which meant the data was very reliable. The readings of the repeats were not identical but were in a five second range, between each set of three readings. This meant that it was a fair test and there were no crtical errors. Even the anomalous results repeats were in a two second range. This showed the experiment was quite accurate.
Improvements and further work that could be added to the experiment would boost the reliability and accuracy of the data. This would include broadening the range of concentrations for Trypsin. We only had a beaker of 1% Trypsin and diluted it to get a range of concentrations; however I would suggest the addition of more pure Trypsin including 2-10%.this would improve the reliability of the data and the trends on both graphs. The temperature, of which the experiment was done in, varied as the experiment was done over 2-3 days. To fully control the temperature I suggest a water container or a water bath that kept the temperature constant. The temperature must be below forty degrees otherwise the enzyme would be denatured or even destroyed. This would lead to much more reliable and far precise results, therefore more conclusive graphs would be produced.