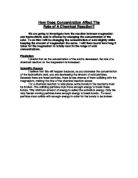
Low concentration of acid Medium concentration of acid High concentration of acid
These diagrams show that the higher the concentration the greater he chance of collision.
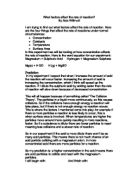
I did a few preliminary experiments first to see which was the best size of magnesium was best to use and the best volume of hydrochloric acid was best to use. These experiments were very important as if I did not carry them out the reaction could be either to quick resulting in me not being able to complete my table accurately or the reaction could be too slow and therefore the number and graphs would be too large to work with. From my preliminary experiments, I decided to use 3cm length of magnesium ribbon and 30ml of hydrochloric acid.
This a table showing the values of the variables in my experiment:
For my experiment, I will need a
- conical flask for the two reagents to react in
- a gas syringe to collect the hydrogen
- measuring cylinder to measure the correct amount of hydrochloric acid.
- a clamp and clamp stand to hold the syringe in place
- a ruler to measure the correct length of magnesium and a
- stop watch to time how long it takes for the reaction to produce hydrogen to the set targets I referred to earlier.
I had research from a number of websites, which included parknotes.com and about.com. I referred to some textbooks, which included Nelson Science and Collins Science.
Here is a diagram of how my experiment should be set up. I have labelled what the apparatus are.
As I stated earlier, in this investigation I will be measuring how long it takes the reaction to produce 5ml, 10ml, 15ml, and 20ml of hydrogen. I will tabulate my results and produce some graphs from my results. Below is a systematic plan to carry out my investigation.
- Set up the apparatus as shown in the diagram.
- Measure 30ml of hydrochloric acid using the measuring cylinder.
- Pour the acid into the conical flask.
- Measure 3cm of the magnesium ribbon using the ruler.
- Drop the magnesium into the acid.
- Quickly put cork into the conical flask.
- Start stopwatch immediately.
- Time how long it takes the syringe to fill 5ml, 19ml, 15ml, and 20ml.
- Record the results in my table.
- Empty conical flask and wash out.
- Repeat steps 2 – 10 with a different concentration of acid.
- Repeat step 2 – 11 six times.
Section 2
Obtaining Evidence
Below is a table showing the results from my experiment. I tried to make this experiment as accurate as possible. I repeated each different concentration of acid six times and then took and average to make the results more reliable. The results were recorded to the nearest second.
Section 3
Analysis and Conclusion
I will now make a table of the average result.
From these results and my graphs over leaf, we can conclude that by increasing the concentration of hydrochloric acid the reaction rate is increased. From my graph, you can see that the 1 molar acid graph was steeper than the 0.1 molar graph, and the 2 molar acid graph was steeper than the 1 molar acid graph. This means that the greater the concentration the faster the reaction occurs because the steeper the graph is the faster the reaction is. I know that the reaction was quicker because there were more acid molecules in the greater concentration; therefore, there was a greater possibility of collision.
Section 4
Evaluation
There are a number of things that could have made my results inaccurate or unreliable.
- Once I dropped the magnesium into the acid it has already started reacting before I had time to push the cork in. This means some hydrogen has already been given off. When repeating the experiment the second time it could take longer of a shorter period of time to do this.
- We cannot measure exactly 3 cm. We have to get as close to this point as we can therefore they will be different sizes.
- When we drop the magnesium into the acid, the acid may not completely cover the magnesium therefore the surface will be different, as the acid is not attacking the other side. If this happens we have to shake the conical flask so the acid will cover the magnesium, this makes the reaction quicker as the acid molecules are moving around faster making it more chance to collide with the magnesium.
- The room temperature was not controlled in this experiment this could effect the result.
I do not think I had any wrong results they seem to be quite accurate. The graphs did not start at the origin. This could be due to the stopper not being put into the conical flask quickly enough therefore some of the hydrogen may have been lost. In the 0.5 molar acid experiment the syringe may have stuck and therefore the graph started quite far from the origin.
I could improve my experiment by putting the stopper in more quickly; find another, more accurate way of measuring the magnesium’ and we could control the room temperature.
To extend my experiment I am going to investigate how the surface area can affect the speed of a reaction. I predict that the bigger the surface area, the faster the reaction will be. This is because there will be more magnesium being exposed to the hydrochloric acid. Therefore, more acid will react with the magnesium.
Here is a systematic plan to carry out this experiment.
- Set up the apparatus in the same way as the previous experiment.
- Measure 30ml of hydrochloric acid using the measuring cylinder.
- Pour the acid into the conical flask.
- Measure 6cm of the magnesium ribbon using the ruler.
- Drop the magnesium into the acid.
- Quickly put cork into the conical flask.
- Start stopwatch immediately.
- Time how long it takes the syringe to fill 5ml, 19ml, 15ml, and 20ml.
- Record the results in the table.
- Empty conical flask and wash out.
- Cut another piece of magnesium 6cm long.
- Cut the piece in half.
- Repeat steps 2 – 10.
- Cut the magnesium into quarters.
- Repeat steps 2 – 10.
- Repeat step 2 –15 six times making the pieces smaller each time.
Here is a table of my results: