Planning
Fair testing
In my investigation only one variable must be altered at one time. The rest must remain constant to ensure accurate results. Many factors can affect the outcome of the results and must be controlled or restricted. The Height of the ramp is the variable I am going to change. The height of the ramp should affect the speed of the trolley in some way. I am going to measure each height accurately from the front of the trolley, deducting the thickness of the ramp.
Friction is one of the factors that could affect the outcome of the experiment. As the trolley moves down the ramp, friction could convert some of the gravitational potential energy into heat and sound. This can also slow down the trolley. To maintain the same friction for all the results we should use the same material for the surface of the ramp, and the same material for the wheel of the trolley.
Obtaining results.
To make this investigation successful, we must choose a sensible range, and amount, of readings to record in order to come up with accurate set of results. It would be pointless to experiment with heights ranging from 1cm-4cm because the speed difference would be minute. I have chosen a range of 40cm – 240cm. We are going to release the trolley three times for each height. To measure the speed of the trolley we are going to use ticker tape. Ticker tape can be used to measure speed and acceleration; the timer dots the tape every 1/50th of a second. Equipment
Apparatus
Trolley – To roll down the ramp.
Ramp – For the trolley to roll down.
Metre Stick – To measure out 2 metres on the ramp.
Tape – To mark the start line.
Ticker tape – To measure speed of trolley.
Books – For one side of the ramp to rest on, to increase the height of the ramp.
Using this equipment, we can easily obtain results with a high degree of accuracy. We can get the height of the ramp at the start line to an accurate degree by simply moving the pile of books forwards or backwards fractionally.
From this experiment I expect to find out what factors affect the speed of a body when no manual force is applied to them (i.e. pushing them).
Method
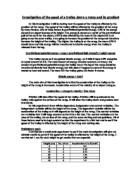
1. Set out equipment as shown in the diagram
2. Ensure the height at the start line is at correct measurement using the metre stick
3. Hold the trolley with its front touching the start line
4. Release the trolley being careful not to exert any force on it.
5. Record the time taken for the trolley to reach the finish
6. Repeat from step 4 twice more so you end up with three results for the same height then continue onto step 7
7. Add all these results together obtain the average
10. Record this average in the table
11. By placing more books underneath the raised end of the ramp, increase the height to the next reading. Use the metre stick to check
12. Repeat from step 4 until you have obtained results for all the heights
Hypothesis
Due to gravitational potential energy (GPE) which is the amount of energy that an object has because it its position. The higher the object is the more GPE it has and my table below proves this. Therefore at the top of the runway the trolley will have more GPE, than when it has come off the ramp.
GPE = mass x g x height
Where g = acceleration due to gravity
= 10m/s²
However when the object begins to fall its GPE is converted gradually into kinetic energy (KE).
KE = 1/2 x mass x (velocity)²
Therefore at the top of the ramp the GPE is at its maximum and at the bottom of the ramp the KE is at its maximum, this is because the energy is being converted as it cannot be destroyed
I predict that as the ramp is raised higher, the speed of the trolley will increase and as the height of the ramp is lowered, the speed of the trolley will decrease.
Results.
Evaluation.
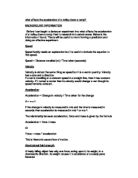
My graph proves that as the height increases the speed also increases and that as height decreases speed also decreases, this shows that my hypothesis was correct. The slight curve at the height between 200 and 270 suggests that another force is acting on the trolley and not allowing it to gradually increase speed. My results display that the higher the ramp the faster the speed. This is because an object, which is a certain distance above the ground, has gravitational potential energy (GPE), and when the trolley rolls down the ramp this energy is converted gradually into Kinetic Energy (KE). By the time the trolley reaches the end of the ramp all the GPE will have converted to KE.
In conclusion to the investigation, I believe that the experiment went very well, I did not face any major difficulties in obtaining or recording my results. If I had more time I would record more results to make my results more accurate. Also I would use a light gate instead of ticker tape, as light gates are more accurate as the ticker tape can cause some friction. Taking 3 sets of results reduced the chance of anomalous results. On my graph there is a slight dip at the height of 200cm and then it increases again at 240cm. I believe that this is because 24 was too steep to measure and therefore gave certain inaccuracies in the results. I believe my results were accurate as they were all near enough the same. Perhaps if I did the investigation again I would also see if mass affects speed.
Conclusion
By conducting this investigation I have found out that height affects speed and height and speed have a positive correlation. As Height increases spped increases and as height decreases speed increases.