Length of constantan wire:
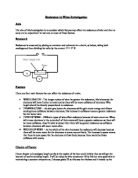
This is the variable that we are working on. It is important that we make the connection as close to the distance we are testing as we can. This means that a connector with a smaller surface area will be better i.e. the wire jockey, which has a smaller surface area than the crocodile therefore it can be placed directly on the interval.
Temperature of wires:
It is critical that we try to keep the temperature of the wires the same because the heating effect caused by the currant will raise the resistance of the wire. This happens because when a substance is heated its atoms gain energy and begin to vibrate. This makes it harder for electrons to flow increasing resistance. Which in turn generates more heat. The only way to prevent it from heating is to remove the flow of electrons by breaking the circuit
Power of the batteries:
The voltage will wear down when in use, which will affect the resistance if R=V/I so we must break the circuit when it is not in use to reduce this effect.
Connecting wires and other components on the circuit:
These have their own resistances. In order to keep them from spoiling results we should make sure that we try to use the same ones. This means that we try and find the same ammeter and voltmeter etc. But in a box of 20 of them this isn’t very easy.
Prediction:
I believe that by increasing the length of live constantan wire you will increase the resistance. I believe this because the constantan is what’s responsible for causing the resistance by slowing the electrons progress.
As noted the atoms in the Constantan slow the electrons down causing resistance. Therefore if you were to double the amount of constantan it would, in theory double the resistance. However, in practice this may not be true as the constantan isn’t the only substance to offer resistance on the circuit. The wires that run between the ammeters etc also bear their own resistance and as I don’t know what those wires are made from I can’t work out their exact resistance but I did take a measurement for 0cm of constantan, which should show roughly what those wires resistances were.
E.g. say the resistance in the constantan at 10cm is 3ohms but over the whole circuit its 4 ohms. This means that the circuits connecting wires are responsible for 1 ohm of that. Now if we double the length of constantan to 20cm that should give 6 ohms but the length of the connecting wires hasn’t changed so it still gives 1 ohm. The total resistance at 10cm is 4 ohms but the total resistance at 20cm is 6+1=7 and that isn’t double 4. It is however, constantly 1 ohm higher of what it should be.
So without taking into account the resistance of the connecting wires the relationship between the length of the constantan and its resistance will progress in a linier fashion but with the connecting wires the relationship becomes stays linear but the resistance will be higher.
Observations
The first two tests were done using an ammeter, a voltmeter and 24swc constantan. The second two were done using two digital Multimeters so presumably the results on the second two tables are more accurate.
Test 1 ammeter/voltmeter:
Ammeter/voltmeter repeat:
Multimeter Test1
Multimeter repeat:
Average resistance over all four tests:
Constantan theory resistances: Using the formula R=E*(L/A) I have gathered the exact resistance of a length of SWG24 constantan regardless of any connections or battery faults:
And this table shows the results of the computer simulation (the computer simulation incorporates the resistance of the connecting wires into the resistance):
We measured the resistance at 0 cm to be 0.35 ohms. However this cannot possibly be true because the average at 10cm was 0.2015 and the resistance
Analysis
This is the average power (I*V) plotted against the average resistance:
This shows that as the length of the constantan increases more power is required to drive the electricity through the wires and at the same time there is also more opportunity for the power to dissipate as heat and light. This possess is used to good effect in electric fire elements where the wire is coiled to add greater length.
My average results of our tests:
The results from the preliminary computer tests:
Conclusion:
From my results and the computer graphs, I can see that the ratio between the length of the wire and its resistance is virtually linear and the theoretical resistance is exactly linier. This makes sense because the constantan wire is of uniform thickness. The resistance on my tests isn’t perfect and this is probably because of the heating effect as explained earlier.
Two things that we can see from this graph are that neither the voltage nor the current are linear. This is because the capacity of the batteries are finite and therefore, as the resistance increases to infinity; the current and voltage will level to the capacity of the battery, curving the graph. Still, you wouldn’t expect the voltage or to be linier in a circuit like this because of the internal properties of the batteries and the heating effect of the circuit.
Another thing we can see is that as the resistance decreases to zero the current and voltage will decrease to zero. However because the circuit will have it’s own fixed internal resistance including: The battery, the meters, the circuit wires, the contacts etc a theoretical zero resistance is not possible in this circuit.
Also as the length of wire decreases to zero the results will become less accurate as the external resistances (mentioned above) become more significant and the temperature rises in the wire are more significant. For example if the internal resistance of the circuit we used totaled 3 ohms and we were testing 0.001 cm of constantan equaling 0.001958 (if R=E*(L/A) is true) then the total resistance is 3.001958 ohms, which is way off the actual total. And as you make the circuit smaller there is less resistance so the current is higher meaning that more heat is generated.
My resistance results on my hand drawn graph are very nearly linear and that supports my prediction that if you increase the length of wire then the resistance increases. As shown, the line of R=E*(L/A) is linear and if you add the internal resistance of the rest of the circuit to that, it is still linear, but appears lower on the graph.
If you take a point on the linear theory line and double its values then those values are true, meaning that in the lines formula X is directly proportionate to Y (this is safe to assume as there are no outside interferences i.e. battery, wires etc only the length and diameter of the constantan). The same is almost true (although shouldn’t be) for my total resistance average line. However, you cannot take the values of a point on the computer line, double them and expect them to be true. This shows that for this line X isn’t directly proportionate to Y but is R=E*(L/A)+the internal resistance of the rest of the circuit.
Evaluation
Comparing my results to the computer generated ones; I’d say that the experiment went quite well. Although some off connections in our circuit were slightly rusty and damaged the results show that it wasn’t too much of a problem. The range of results obtained was sufficient to form good averages which were comparable to the results obtained from the computer and the results generated by R=E*(L/A), and the results supported my prediction. I believe the results to be accurate because they are fairly consistent with each other. For example on the multimeter test at 50cm the resistance was 0.9375 ohms and on the repeat I got 0.88 ohms. This means that there was only a 0.0575 ohm difference between them. However the results obtained from the voltmeter/ammeter tests were less accurate as it is very hard to read off them to more that 2dp.
One strange thing with the results I obtained was that the resistance was much lower than I expected. This is shown by the graph. I would have expected the line to be closer to the computer simulation than the R=E*L/A line because R=E*L/A doesn’t account for resistance where as the computer simulation does. My experiment certainly had resistance in the circuit and yet my experiments line falls almost on top of the one that doesn’t. There are a few ways to explain this. The current in the simulation was lower than the current in real life, the internal resistance of the circuit was very low (which I find hard to believe) or the measurements weren’t accurate enough, either way there is no definite answer.
Also on my hand drawn graph there are 3 obvious anomalous results, which didn’t fall on the line of best fit. They are likely to have been caused by poorer measurement, kinks in the wire or a bad connection (more sources of error have already been stated in the plan). However, I think that the evidence is still sufficient to support the conclusion.
The way we set up and conducted the experiment was the standard however if I was to do repeat he investigation I would use much shorter circuit wires and use better connections to minimise circuit resistance. It might also be a good idea to use a rectifier instead of batteries so that draining power isn’t an issue. You could also extend the investigation by measuring other variables such as temperature and wire diameter.