The apparatus we are going to use to carry out this experiment are:
- Connecting wires
- Crocodile Clips
- Shunt
- Ammeter
- Lab Pack
- Meter Ruler
- Scissors
- Tape
- 1 Wire – (the tested wire)
- Voltmeter
Safety Precautions - We plan to carry out this practical safely by making sure we handle the equipment carefully and we are sensible. Also, logical safety procedures for using electricity such as plugging the wires correctly and not have wet hands when switching the socket on.
Prediction
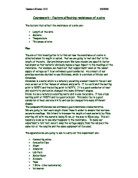
My prediction for the length of the wire affecting the resistance is that the longer the wire, the more resistance there is and the less the current flowing through. This is because when there is a longer distance for the electrons to travel, there is more chance of them colliding with the atoms and this decreases a tiny bit of the current, and increases the resistance. The metal atoms become ionised when hit by electrons. The longer the wire gets, it will have more resistance as there is a larger chance for the moving electrons to collide in the atoms.
Since the wire is shorter, the electrons have a higher chance of flowing through the wire without colliding into the atoms.
Collision
- Atom
- Electrons
Diagram
\
Method
- Before beginning the practical assignment, we had to consider safety. The equipment was handled safely as we carried it through the room to our table
- We made sure the wires were securely insulated and that they weren’t placed anywhere were it could be harmful to us
- We made sure our hands weren’t wet when handling electricity
- The table was wooden and so was the meter ruler and so electricity wasn’t conducted through them
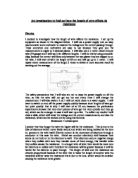
- We then collected our appropriate equipment and set it out as shown in the diagram above
- The wire we were testing, Nichrome was measured out to 100 cm, and was stuck onto the meter ruler with a tape.
- The connecting wires were formed to make a circuit including the lab pack and ammeter in series, and the shunt in parallel to the nickel chromium.
- We set the lab pack to give a DC supply of 1V.
- The crocodile clips were set so that 10 cm of the nickel chromium was part of the circuit.
- We recorded the reading of the amps and the volts
- We then moved one of the crocodile clips along 10cm so that the tested length of the wire was now 20cm.
- We recorded the reading of the amps and the volts
- We did the same for 30cm length, 40 cm and 50 cm length and we recorded all the results.
- We did this wire and each length two more times and recorded the results. This was to make sure we had accurate results.
- We carefully returned all the equipment and made sure that that when taking out the plug, we didn’t pull it or didn’t have wet hands.
- Finally, we calculated the resistance with the data obtained.
Results
Material: Nichrome
Try 1:
Try 2:
Try 3:
Graphs
Conclusion
We found out that as we increased the length of the wire, the current decreased slowly and the potential difference of the wire increased. When these two readings were put in the Equation, R = V/I, we got the resistance and found out that it did increase as we went through the table.
We found out that as the length was being increased, the electrons within the wire where having to take a longer route and this made it more likely for them to collide with an atom. If an electron collides with an atom, then it loses its energy and therefore the current is reduced slightly. This was what was happening inside the wire.
Looking at the Graph showing the result of Resistance 1, it is easy to see that apart from one reading, my results are all consistent and the straight line of best fit touches nearly all the dots. This shows that the length and resistance were proportional. The graph showing the results of Resistance 2 is also quite consistent in the results apart from the reading which was odd in the first trial as well. At once this proves that we weren’t carrying out the experiment incorrectly but instead, when the length was increased to 50cm, the resistance increased a lot more and therefore was the odd one out on the graph. Referring to the Resistance 3 graph, we can notice that the line of best fit is much steeper and the results are slightly less concentrated. This time, the resistance at 40cm is rather odd.
However, when looking at the graph which shows the average resistance of Nichrome as the length of the wire increases, we can see that all the results are close to the line of best fit and none are strikingly odd. The line of best fit is straight and it is easy to see that the length and the resistance are related.
This is corresponding to Ohms Law: The voltage across a metal conductor is proportional to the current through it, provided the temperature stays constant.
The graph is a positive correlation where as the length increases, so does the resistance, proving Ohms law.
The most reliable graph would be the one with the average line of best fit, because it gives an average reading for the three attempts and also shows that none of the results were anonymous and it clearly shows that as the length increases, so does the resistance.
Evaluation
I felt that the experiment was as accurate as possible, according to the unpredictable school equipment and therefore, although we didn’t have too many problems, the apparatus may have caused our results to be slightly affected.
There are a few ways in which I could have made our experiment better with a set of more precise results, but we didn’t have the required equipment. For instance, if I could do this experiment again, I would measure the direct resistance using an ohmmeter, instead of using a Voltmeter and Ammeter to calculate it. The reason I would do this for is that sometimes, there might be a fault with either the voltmeter or the ammeter without us acknowledging it and therefore, the calculation would give an incorrect answer. In this case, the ohmmeter would give a straight forward result.
However, there is always a possibility of the ohmmeter having an error in it and therefore, a way of extracting a reliable set of results would be to simultaneously test the resistance with the voltmeter and ammeter and calculating the results, as well as getting a direct reading from an ohmmeter. The advantage of carrying this experiment out would be that for each length of wire, we would get two resistance readings, either the same or slightly different, giving a clearer idea of the accuracy of our experiment.
All my results were consistent except for one odd one out. Despite that, I was happy with my results because I got a straight line showing that resistance is proportional to the length as suggested by the Ohms Law. However, I don’t think there is enough evidence here to prove that length is definitely a factor which affects the resistance and therefore it would not be a good idea to experiment with the other potential factors until this one can be proved trustworthy.