Using these two theories, I feel I will obtain a straight line graph, showing the proportionality between T^2 and L (as the length increases, the time taken would proportionately increase)
Variables:
Independent:
Dependent:
- Time taken for a 10 complete oscillation
Constant:
- mass of metal bob at the end of string
- Number of oscillations
Fair test: to make it a fair test (to ensure that physical conditions are fair, and the results are accurate) a few points important should be implemented:
- After the experiment, you should check the length of the string again (the weight of the metal bob could cause the string to increase in length- as it could slip down from the cork), and if observed that the length has changed, redo the experiment, this time tightening the string to the cork. So that less errors takes place.
- The string should be attached tightly to the clamp so that the above case can be disregarded.
- Hold the stand down so that it does not shake, causing inaccuracies in the results.
- Make sure no parallax errors are made, while measuring the string. It should be measured by the rue keeping it at eye level.
- Make sure the stopwatch is started and stopped, as soon as the string is left, and the string completes 10 oscillations, for all the following experiments.
- All experiments should be done on the same day, as the temperature and air in the room would be the same and have the same properties, and therefore the environment would be the same for all tests as there won’t be any differences.
- Take many measurements (length) of the string, so as to achieve a comprehensive range, and hence a more comprehensive graph so that results are more accurate and the experiment is more precise.
- Make the constant number of oscillations 10, so as to reduce the margin of error, and due to time constraints.
- Make sure you have 2 readings per length, so that an average can be taken, and the result would be more accurate.
Apparatus:
- Clamp
- retort stand
- Rubber cork
- String
- Cork
- Metal bob
-
Meter rule (+0.05cm)
-
Stopwatch (+0.005s)
-
Protractor (+0.5 Degrees)
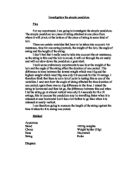
Procedure:
- Take a length of string, with the metal bob attached, and measure it to 15 cm.
- Set up the apparatus as shown above (attach the string through the cork and place the cork in the clamp.
- Tie the left over string, tightly to the clamp, so that the weight of the metal bob does not cause the length of string to change
- Take the metal bob and string and take it a little to the left, as shown in the diagram.
- As soon as the bob is left, start the stopwatch.
-
Count 10 complete oscillations, and stop the watch at the end of the 10th.
- Record the time taken, in a tabular format, and remove the string from he cork
and the clamp.
- Repeat steps 1 to 7, varying the measurement of the string each time with measurements such as:
-20 cm
-25 cm
-30 cm
-35 cm
-40 cm
-45 cm
-50 cm
- Record all your readings, and display them in a tabular format.
Data collection table
- Processed Data collection table:
Formulas used:
Average of 2 readings= reading 1+ reading 2
2
Time taken for 1 oscillation= Time taken (T)
Number of oscillations (10)
Final time used for graph= time taken for one oscillation^2 (T^2)
Therefore the processed data would be:
Data in the form of a graph (verifying if time taken (T) is proportionate to the length (L) of the string)
Conclusion:
In conclusion, the hypothesis was proven right, as it was stated before that the smallest length would produce the smallest time period, and the largest length would produce the largest time period. This therefore verifies the idea that the time is proportional to the length, as the graph clearly shows the time taken increases as the length of the pendulum increases. The time period of the shorter length is small because the pendulum swings faster- as the metal bob is being held from a shorter distance, then it does not have to travel much further, in order to complete one oscillation, due to the short length of the string, and the therefore the torque produces is lesser. On the other hand, when the string is increased in length, it moves further away from its hold on the clamp, and therefore to completes one oscillation, it would have to travel a greater distance, increasing the torque produces, and therefore taking a longer time to complete one oscillation. This proves that T^2 is proportional to L.
From the graph, it can be seen, is not a completely straight line graph, showing anomalies, and hence showing that a couple of errors that could have occurred, keeping the line from being straight. But the rising slope of the line in the graph proves the hypothesis that was stated before that the time period would increase with the increase in length, therefore the experiment was successful.
Note: the milliseconds that were taken into consideration when plotting the graph, could have kept it from being a straight line, as it was a default of reaction time. If the results were seen as only seconds, the data table would have had ideal readings, and the line would be completely straight- but we felt the milliseconds were necessary, to show that there were errors, however unintentional, and that the experiment was not 100% accurate.
Evaluation:
The experiment was successful in proving my hypothesis and verifying the proportionality of time against length, in fundamental terms, but a few human errors, as well as the instrument’s inherent uncertainty could have caused the experiment to have a few anomalies, therefore preventing the graph above from being a straight line. These errors which could have taken place were:
Systematic errors: (uncertainties of instruments)
Formula used- least count/2
-
-Meter rule: the uncertainty for the mere rule was +0.05cm (0.1/2)
-
-Stop watch: the uncertainty for the stop watch was +0.005s (0.01/2)
-
-Protractor: the uncertainty for the protractor was +0.5 (1/2)
These uncertainties only show us how much the results could be uncertain or inaccurate by. But as these values are not very large, therefore the experiment could not have been greatly affected by it and cause inaccurate results.
Human errors:
- A parallax error which could have occurred might have been made while measuring the length of the string.
-
Reaction time constraints- the time when the pendulum might have been released, and the start of the stopwatch, might not have not matched and occurred at the same time, and the stopping of the stopwatch, when the pendulum reached the 10th oscillation might not have been the same.
- The hold on the thread could have differed (the thread might have been put differently into the cork, making the hold different)
- Wind in the room could have affected the time taken to complete 10 oscillations.
- Even though the stand was held in place to avoid it shaking, lack of concentration, or a slack grip could have resulted in the stand shaking.
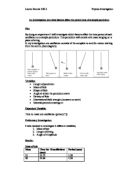
While doing the experiment, we saw other people swinging their pendulum from a certain angle, with the use of the protractor, for all their tests. As we knew that the angle would not make a difference to the time period, so we had not used a protractor for our tests, we verified our knowledge, by doing a few tests, and these were the results:
(The length of the string was kept as 20cm)
Each oscillation took 0.9seconds. The millisecond has not been included, as that could be different due to human reaction time not being the same in all cases. These results merely show that you do not need to swing the pendulum from the same angle, as a constant, in order to derive accurate results. Therefore, not using the same angle for all the tests could not have been an error, on our part.
Note: implementing the points shown to make it a ‘fair’ test reduced the margin of error.