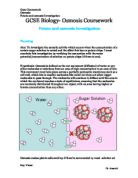
- Difference in concentrations – This will speed up the rate of osmosis because there will be more particles that’ll have to change places.
- Surface Area – This will speed up the rate of osmosis because there will be more space on the potato for osmosis to take place.
- Concentration of water in potato – the higher the concentration of water in the potato the quicker osmosis will happen because less water will have to enter into the potato to even the amounts of water inside and outside the potato.
Equipment
For the experiment I used:
· A ruler - to measure the length of the potatoes so we knew where to chop them.
· Top-pan balance – we used this to find the weight of the potatoes, and we used it to two decimal places.
· Test tubes – we put the potatoes in these
· Water/Sugary solution – we used this at 0,2,4,6,8 & 10 concentrations. 0 being pure water and 10 being 10 % sugar solution.
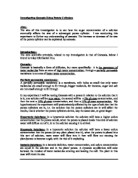
We chose the variable: “Concentration”
Method
In the experiment I chopped three thin potato strips. Then I measured them on the top-pan balance and record their weights. Then I put them in a test tube with a sugary solution. I did this six times so in the end I had 6 test tubes with three pieces of potato in each and 5cm cubed of solution in each. The concentrations will vary for 0 – 10. Then I will leave it 24 hours and then record the results. I will do the experiment twice to get more accurate results.
Fair?
I made this experiment a fair test by making sure all the slices of potato are the same mass and length, I made sure each test tube have the same amount of solution in, I made sure the temperature was where it was kept were it was always the same. I wasn't able to maintain the temperature all the time but I was able to make sure the mass of the potatoes and the amount of solution will be the same.
I did the experiment twice, and each time get the averages of the weights of the potatoes at the beginning and end of the experiment. This proudced more accurate results.
Analysis
In the 1st experiment - as the concentration got higher, the mass of the potatoes got lower, but the graph did not end up as a curve which it is supposed to look like.
In the 2nd experiment, as the concentration go higher, the mass of the potatoes got lower. The graph looks more like a graph with a curve in but still, it is not exactly right.
My prediction is not compleatly correct. In some cases it is correct because the concentration is higher and the mass of the potato is lower, but in other the mass of the potato gets higher, which I did not predict.
For example, on the 1st experiment at 2 and 4 concentrations the mass of the potato goes up and the same happens on the 2nd experiment.