Control Variables
The Independent Variable is the concentration of the sucrose solution
The Dependant Variable is the mass of the potato
The Control Variables are the temperature of the water, the time the potato is left in the water and the mass of the potato chip
Preliminary equipment
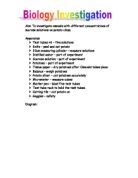
I will use this set of preliminary equipment:
- 6 test tubes
- 1 test tube rack
- 1 potato cutter
- 1 potato
- 1 scalpel
- 1 chopping board
- 60 ml of 1.0 molar sucrose
- 60 ml of distilled water
- 1 measuring cylinder
- 1 electronic balance/weighing machine
Preliminary work
I am doing a preliminary experiment to test my method and concentrations and find any errors and mistakes that there may be in them, and change the method for the main experiment, to make the results more accurate and reliable. I also did preliminary work to get an idea of what the conclusion will be and to gain experience.
For my preliminary work I used the equipment stated above.
Preliminary method
- Cut up the potato with the potato cutter
- Cut 6 chips to the same length with the scalpel on the chopping board
- Measure out the different sucrose concentrations for each test tube using the measuring cylinder: 0 molar (100% water) for tube 1; 0.2 M for tube 2; 0.4 M for tube 3; 0.6 for tube 4; 0.8 M for tube 5; and 1 M for tube 6.
- Record the mass of each chip on the balance
- Put the chips into the tubes.
- After 30 minutes, take out the potato chips
- Mass them again on the balance.
- Record masses.
Preliminary results
My preliminary work seems to suggest that my predictions were correct, and that with the lower sucrose concentrations the potato chips increase in mass, and vice versa.
After having done some preliminary work, I have decided to make some changes to my method.
- I will do each sucrose concentration 3 times, so that my results will be more reliable and accurate. By doing this I can identify anomalous results.
- I will leave each potato chip in the solution for 1 hour, so that osmosis will have occurred more fully by the time it is taken out to be massed, and this will make the results more reliable.
- I will use a syringe rather than a measuring cylinder, as the scale on a syringe is smaller so I can more accurately measure out a volume of water. This will make the results more accurate and reliable.
- I will cut the peel off both ends of the chips, so that there is an equal surface area for the water molecules to enter or leave the potato chips by osmosis, so the rate of osmosis is equal for all the chips.
- I will cut the ends of the potato chips vertically, so that the surface areas are more similar, as if the ends where cut at different angles, some chips would have a larger surface area therefore osmosis would happen more quickly in those chips. So by doing this the result will be more reliable.
- I will use boiling tubes, so that less of the potato chips touch the sides and there will be more accessible surface area for water molecules to either enter or leave the potato chip by osmosis.
- I will use bungs on all of the boiling tubes to prevent the water in the sucrose solutions from evaporating, so the water potential will only be affected by water entering or leaving the potato chips, and not by water evaporating. This will make the results more accurate and reliable.
- I will remove the excess water from each chip with a paper towel after it has been removed from the solution before massing, so that only the chips is being massed and the water doesn’t add to the mass. This will make the results more accurate and reliable.
Obtaining evidence
Method
This is the method I will use for the main experiment.
- Cut up the potato with the potato cutter
- Cut 18 chips to the same length with the scalpel on the chopping board making sure to remove peel from both ends
- Measure out the different sucrose concentrations for each boiling tube using the syringe: 0 molar (100% water) for tubes 1-3; 0.2 M for tubes 4-6; 0.4 M for tubes 7-9; 0.6 for tube 10-12; 0.8 M for tubes 13-15; and 1 M for tubes 16-18.
- Record the mass of each chip on the balance
- Putting the chips into the boiling tubes and put bungs on.
- After 1 hour, take out the potato chips.
- Dry them with a paper towel
- Record their Mass again on the balance.
I will conduct my experiment safely by wearing goggles, wearing a lab coat, and handling the scalpel with care.
Table of results for main experiment
Analysis
My results prove that my prediction was correct, and that with lower sucrose concentrations, i.e. 0.0 M and 0.2 M, the potato chips gained mass, and with the higher sucrose concentrations, ie. 0.4 M, 0.6 M, 0.8 M and 1.0 M, the potato chips lost mass.
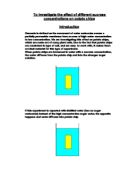
I can explain what happened to the potato chips through osmosis. Osmosis is when water moves from an area of high water potential – or high water concentration – to an area of low water potential through a partially permeable membrane. So, when the potato chips had a higher water potential than the sucrose solution, they lost mass as some of the water inside the cells in the chips moved into the sucrose solution. When the potato chips had a lower water potential than the sucrose solution, water moved into the chips, so the chips gained mass.
When the sucrose solution and the potato cell sap are in equilibrium, or the same, the potato neither gains nor loses mass. From my graph, I can determine when there would be no change in mass, and thus at what concentration the cell sap and sucrose solution are at equilibrium. According to my graph, the exact water potential of the potato chips is 0.32 M. 1 1
Evaluation
I think that my results are accurate enough to prove that the potato chips gain mass in lower sucrose concentrations and lose mass in higher sucrose concentrations. My conclusions support my predictions to the extent that I have an approximate value for the concentration of the potato chip cell sap: 0.32 molar. However, my experiment was not focused around this specific point (the nearest values for sucrose concentration were 0.2 M and 0.4 M), so this result is most probably slightly inaccurate. I think that the evidence from my results is sufficient enough to prove that in lower sucrose concentrations potato chips gain mass, and in higher sucrose concentrations potato chips lose mass. However, I have insufficient evidence to prove what the exact concentration of the potato cell sap is.
Reliability and accuracy of results
My results are accurate because I did some preliminary, so I could change any mistakes with the method before I did the main experiment. I also changed many aspects of my method of measuring, such as using a syringe rather than a measuring cylinder, and using an electronic balance to give more accurate results to 2 decimal places. There were no apparent anomalies in my results. The results on my graph are all near or on the line of best fit, so my results must be accurate and reliable. Also, the repeats for each concentration are quite similar, which means that the results must be quite accurate and reliable.
Making results more accurate and reliable
However, if I wanted to work out more precisely what the concentration of the potato cell sap is, I would need to use more accurate measurements and a more detailed concentration range around the predicted concentration of 0.32 M, i.e. 0.25 M to 0.35 M. I could do this by using a graduated pipette instead of a syringe for measuring out the sucrose and water. I could also use a more accurate balance, i.e. 3 or more decimal places. I could also do the experiment for 2 or 3 hours so that the potato chips were in the sucrose solution long enough for osmosis to have fully occurred. However, if I left them in the sucrose solution for too long, they might disintegrate and couldn’t be massed. I could also repeat each solution more times, not just 3 times. This would mean that I could rule out any anomalies, and even if there weren’t any it would still make the final results more accurate and reliable. I could try and get the potato chips from the same potato, but 1 potato may not be enough for 2 or more repeats. This could help make the results more accurate and reliable, as chips from the same potato will have the same concentration of sucrose in their cells, so different cell sap concentrations wouldn’t affect the results. I could also use a bigger range, e.g. do the odd numbers as well, 0.1 M, 0.3 M etc, or go up to 2.0 molar. A bigger range (0.0 – 2.0 M) would mean that the graph may level off or plateau, as at that no more water could be lost from the potato cells. I could also try to stop the potato chips in the higher sucrose concentrations from floating, as they have a lower surface area than that of chips that aren’t floating, so if they are totally submerged then all of the chips would have an equal surface area for osmosis to occur on. This would make the results more accurate and reliable. I could do this by sticking a pin into the potato chip and sticking to pin to the bottom of the test tube using blue-tack. Instead I could stick a pin in the top of the chip and if the pin was long enough it would press against the bung and the chip would still stay submerged.