30 1.13
20 0.91
10 0.61
Conclusion;
I am going to use the length of string as my variable in my final experiment, because it had the largest differences between results.
Using the results from my table of length of string I drew a graph to show what had been obtained from the experiment (see graph paper no.1). The graph clearly shows a smooth curve with a positive gradient. This indicates that as the length of the pendulum is increased, the period will increase.
The evidence obtained from my experiment supported my prediction that as the length of the pendulum increases, the period increases.
Factors which could have affected the accuracy of my results include;
- Error in measurement of angle of altitude. This angle proved hard to measure and it was hard to get the exact same angle for each result. To improve the accuracy of this measurement, I could have attached the protractor to the clamp stand so that it was in a fixed position.
- Error in measurement of string. To improve the accuracy of this, I could have marked off the points with a pen to ensure they were as accurately measured as possible.
- Human reaction time. Depending on human reaction time, the measurement period time could have been measured inaccurately, due to slow reactions when setting the stop-clock etc. This could have been improved by involving another person to aid me with my experiment for a quicker reaction time.
If I were to extend my investigation I would investigate the affect of gravitational field strength on the time period of a pendulum. I.e. not 9.8 newtons. But I am not able to do this due to lack of equipment.
I have also concluded that I will repeat each result in my final experiment three times, to get an average of the results, as I found that I acquired quite a lot of miscellaneous results during my investigation. I will measure 10 oscillations so that I will get the most accurate result possible. The reason that it would be hard to do this is because I need to make the measurement accurate by decreasing the risk of error. This is because, if you are only measuring one oscillation, you have to turn the stop-clock on and off, taking roughly 1 second. Which is also the time (roughly) for one oscillation. Making the percentage of error 100%. But, if I repeat the experiment 10 times (read 10 oscillations) then there will only be a 10% error.
I am going to use a 10 degrees angle. Because the smaller the angle the more it will stay at that angle. Also it is important to keep the same throughout the experiment because then it will be a fair test. I will make sure of this by using a piece of paper with a straight line on it, behind the pendulum to measure the angle with the protractor with.
Background information
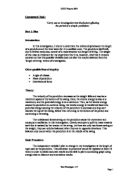
The pendulum is able to work when the bob is raised to an angle larger then the point at which it is vertically at rest. By raising the bob, the pendulum gains gravitational potential energy or GPE, as in being raised, it is held above this point of natural suspension and so therefore is acting against the natural gravitational force. Once the bob is released, this gravitational force is able to act on it, thus moving it downwards towards its original hanging point. WE can say therefore, that as it is released, the GPE is converted into Kinetic energy (KE) needed for the pendulum to swing. Once the bob returns to its original point of suspension, the GPE has been totally converted into KE, causing the bob to continue moving past its pivot point and up to a height equidistant from its pivot as a starting point. Due to this motion, the bob creates an arc shaped swing. The movement of the pendulum is repeated until all the energy has been transferred to sound and heat energy.
At stage 1 the pendulum has maximum GPE and zero KE.
At stage 2 the pendulum has minimum GPE and maximum KE.
At stage 3 the pendulum has maximum GPE and zero KE.
At stages 1 and 3, the pendulum is stationary.
At stage 2, the pendulum has its fastest speed.
The pendulum does not carry on forever because some of the energy is being transferred into sound and heat energy. This happens by the energy transferring because it is transferred to the air particles, when it runs against them.
If I needed to calculate the gravitational potential energy or kinetic energy being used in the pendulum, I would use these equations:
GPE = mass x gravitational force x height
KE = ½ MV x V
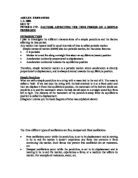
This diagram shows the forces acting on the mass on a simple pendulum. When the string is at a small angle to the vertical. One of these forces is the weight of the bob and the other is the tension on the string. Because they are not equal and opposite to one another. There will be an acceleration in the direction at right angles to the string. The diagram shows mg split into two components, one of them at the right angles to the string and the other in line with it. Newton’s second law can be applied to the motion at right angles to the string, taking care to assign positive signs to directions to the right since X is measured from the centre to the right.
I also found one equation that explained the results to my pilot experiment:
This equation shows that the mass of the bob has no consequence to the time period as it is not in the equation ( mass ). This equation also shows us that length of the string is the only variable which will work, to provide a range of results.
I also found these two equations to work out the kinetic and potential energy.
Kinetic =
Potential =
The resources that I used to do my research with are, www.GCSESCIENCE.com . The text book “physics” by Robert Hutchings, mainly. Along with other physics text books. And other internet sites.
My Final experiment
Hypothesis
I predict that the time period well be affected by the length of the string.
-This is because of the equation, which I found and showed in the background section, showing that the mass of the bob has no consequence to the time period as it is not in the equation (mass). This equation also shows us that length of the string is the only variable which will work, to provide a range of results.
I predict that as I increase the length of the string the time period will increase.
-This is because I looked at the results of my pilot test and the graph, which showed a curve, showing that when the length of the string was increased, so was the time period. So I used this knowledge to predict what would happen in my main experiment.
I also did some calculations to prove my point.
T = 2 10/9.8 T = 2 60/9.8 T = 2 100/9.8
=2.03 =4.97 = 6.41
These sums prove my hypothesis that as the length of string is increased, so will the time period.
Safety
The following factors will be considered when doing my main experiment:
- That the clamp stand is firmly secured to the bench.
- No angle above ten degrees will be used (resulting in large swings.)
- Care will be taken not to let the mass come into contact with anything whilst swinging.
Apparatus
- Meter ruler (to measure the length of string)
- Protractor (to measure the angle of elevation)
- Clamp stand
- G-clamp
- Stop clock
- String
- Masses (100g)
- Cork cut in two (this was used to hold the string in place at the top of the clamp. I used the cork because then the energy will not be wasted on the vibration at the top of the clamp, if it was just tied on. Instead, all the energy is concentrated on the mass at the bottom).
Method
- Firstly the clamp stand was set up with a piece of string measuring 100cm. This was clamped between two pieces of cork. And was measured by a metre ruler.
- A piece of paper with a straight line was placed behind the string, exactly in line with it.
- Using the line on the paper. 10 degrees was measured with the protractor, and then the string was lifted to that angle of elevation.
- The string was then released, and at the same time. The stop-clock was started.
-
10 oscillations were then measured and the stop-clock was then stopped at the 10th.
- This method was then repeated 3 times for each length.
- Then the string was shortened by 10cm each time.
- (However I did not have enough time to do 12 different lengths, but I still wanted to collect as much varied results as possible, so from 60cm onwards I investigated every 20 cm).
How I made my experiment fair
I made my experiment fair by repeating each length of string 3 times. This is so I could lessen my chance of getting a miscellaneous result. And then I could get more accurate results by working out an average. I also measured 10 oscillations instead of 1. This is because, if you are only measuring one oscillation, you have to turn the stop-clock on and off, taking roughly 1 second. Which is also the time (roughly) for one oscillation. Making the percentage of error 100%. But, if I repeat the experiment 10 times (read 10 oscillations) then there will only be a 10% error. During the experiment I was careful to use accurate measurements in order to obtain as accurate results as possible, I measured the string with a meter ruler, to the nearest millimetre to ensure that each measurement was exactly 10cm shorter then the last. The angle of amplitude was measured to the nearest degree to ensure that the angle remained at 10 degrees throughout the experiment. I used a stop-clock to measure the time period, I displayed the results with 2 d.p. to increase the accuracy of the graph and table. The only variable that I changed was the length of the string,
Table of results of Main Experiment:
I calculated the average by adding together the results for the three repeats of 1 oscillation, and then divided it by three.
i.e. repeat 1 + repeat 2 + repeat 3
3
(see graph paper 2)
My graph, which I plotted to show the average results for one oscillation, was not a perfect curve. To make these results into a line, I used the equation T= 2
Using this equation I also used the equation for straight lines; g = mx + c.
I then arranged the first equation to match this equation, so I could plot a straight line.
T = 4 l/g. I then squared my results:
(see graph paper 3)
As you can see on the graph paper, the line of results is reasonably straight, although the measurement for the 120cm string is a miscellaneous result, which I have circled. This could have been due to :
- Error in measurement of angle of altitude. This angle proved hard to measure and it was hard to get the exact same angle for each result. To improve the accuracy of this measurement, I could have attached the protractor to the clamp stand so that it was in a fixed position.
- Error in measurement of string. To improve the accuracy of this, I could have marked off the points with a pen to ensure they were as accurately measured as possible.
- Human reaction time. Depending on human reaction time, the measurement period time could have been measured inaccurately, due to slow reactions when setting the stop-clock etc. This could have been improved by involving another person to aid me with my experiment for a quicker reaction time.
I also worked out the gradient of the line using the equation (see graph paper no. 3)
Analysis
The results, which I have gathered, have shown me that when I increased the length of string, the time period increases.
The first graph which I drew (graph no.2) does not have a “perfect” curve, at first I thought this was because my results were not accurate, but by drawing the straight line graph I know now that my results were fine except for the miscellaneous result for the 120cm string. The average (squared) for this length was 4.28, which is a massive difference from the average (squared) for the 100cm string, which was 3.50. Most of the other results went up gradually (1.02,1.37,1.64 e.t.c). Another result, which was miscellaneous, was for the 50cm string, one result was 13.53 unlike the others, which were closer together, (14.23,14.06,13.94).
The results, which I gathered support my predictions, that as the length of the string is increased, so is the time period. The equation shows us this by enabling us to work out what the time period is for each length of string. This is also shown on my graph, no.3, showing a straight line, increasing as the length of string was.
The procedure, which I used, was quite reliable, except for human error, which was avoided as far as the equipment provided would let us.
If I were going to extend my investigation of the pendulum, I would investigate to provide additional evidence to support my theory. I would do this by repeating my method, but with additional lengths to provide me with a clearer graph, and further prove my theory. It would also be interesting to investigate how the Gravitational Field Strength would affect the time period, however this would not be possible due to lack of equipment.
If I were to repeat the experiment I would consider these factors more carefully to provide me with more accurate results;
- Measure the angle of elevation more accurately, this was hard to measure exactly the same for all of the lengths and repeats, even though I used a piece of paper with a straight line sown the middle as an angle “0”, an stuck a protractor onto the clamp to make sure it was positioned exactly the same each time.
- Improve on human reaction time, the measurements could have been recorded inaccurately due to slow reactions when setting up the stop-clock e.t.c. To have obtained more accurate results I could of measured more oscillations then 10 (for example 20).
Most of my results were accurate, this is shown, as several of my repeats were exactly the same, for the 30cm string, two results, 11.68 and 11.68 were the same. And for the 20cm string another two were exactly the same. 10.12 and 10.12. There were many other results, which had results only a few decimal places difference. This shows the reliability of my results.