Investigation of the reaction between Hydrochloric Acid and Calcium Carbonate chips
Investigation of the reaction between Hydrochloric Acid and Calcium Carbonate chips
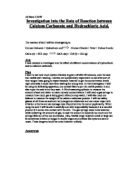
Balanced Equation of reaction:
Calcium carbonate + Hydrochloric acid = Calcium chloride + Water + Carbon Dioxide
CaCO3 + 2HCl = CaCl2 + H2O + CO2
Rate of reaction and what alters the rate of reactions
Rate of a reaction is a measure of the speed at which a reaction takes place and is found out by:
Rate= Change in amount/Time taken
Rate occur only when particles: - Collide
- With enough energy
Different factors change the amount of collisions there are, the more collisions the rate of reaction is faster.
The variables that change the rate of reaction are: - Surface area
- Concentration
- Temperature
- Catalysts
Surface area- When the surface of the substance being reacted (solid) has a large surface area for example powders the rate of reaction is high and the substance is reacted very quickly but if it has a low surface area for example a ball the rate of reaction is low and the substance takes a long time to react, this is because the acid have more solid to react with so there are more collisions causing a higher rate of reaction the more surface area there is.
Concentration of solutions- When the solution (acid) that is reacting with a solid is highly concentrated the rate of reaction is high and the solution reacts with the solid very quickly but if the concentration of the solution is low the rate of reaction is low and the solid reacts slowly, this is because when the concentration of the acid is high then there is lots of particles in a certain area(cm3) so more collisions and the more collisions the higher the rate of reaction is.
Temperature- When the solid is being reacted into the solution at a high temperature the rate of reaction is high and the solid dissolves quickly but if it is at a low temperature the rate of reaction is low and the solid will react a lot slower, this is because when the temperature is high the particles move around a lot faster and there are more collisions so the rate of reaction is high.
Catalyst - Use of a suitable catalyst means that the particles may react even if they collide with only moderate energy. This means more successful collisions are likely. Some catalysts work because one of the particles is fixed to a surface. This makes the chance of a collision more likely. More reactions means a higher rate of reaction and the solid will be dissolved by the acid quickly.
Which variable and why?
I am going to investigate how the concentration of the acids changes the rate of reaction. I have chosen to do this because it is interesting yet simple and I believe the other variable are harder to investigate.
Why not the other variables
Surface area- The surface area of the solid to be reacted (calcium carbonate) would be very difficult to measure and to be precise and I could only get the chips into rough categories ( Small and large) so I decided against this variable.
Temperature- To get the acid and solid mixture to the right temperature will be very difficult and inaccuracy is likely and this could change the results slightly so I have decided against investigating the temperature variable.
Catalyst- In further research I found no catalysts that I can use in my investigation so no catalyst will be used in the experiment
Quantitative prediction
When the concentration of the acids is 0 and when the experiment is timed out the mass of the solution of water and solid will have decreased 0 grams if the acid is completely concentrated the mass will decrease by 2 grams I also predict that 25% concentration gives a 0.5 gram decrease and 50% will give a 1 gram mass decrease and that 75% concentration will give a 1.5 gram mass decrease because the experiment will be in a quantitative relationship of that when you double the concentration the mass loss will also double . Also if the concentration is double e.g. 50% is double 25% the reaction will react twice as fast e.g. 25% concentration mass loss is 0.5 grams so at 50% mass loss will be 1 gram.
What to measure for rate of reaction
The solution of acid (hydrochloric acid) and solid (calcium carbonate) will be measured out before the experiment begins it will be left to react for 3 minutes and then measured again the change in mass will be how much of the solid has reacted and gas given off.
Method
5 measuring cylinders of 10 cm3 of hydrochloric acid will be set-up one with no concentration(water), one 5 cm3 of hydrochloric acid with 5 cm3 of water(50% acid concentration) and one 10 cm3 of hydrochloric acid(100% acid concentrated) and with acid concentration 25% and 75% each will ...
This is a preview of the whole essay
The solution of acid (hydrochloric acid) and solid (calcium carbonate) will be measured out before the experiment begins it will be left to react for 3 minutes and then measured again the change in mass will be how much of the solid has reacted and gas given off.
Method
5 measuring cylinders of 10 cm3 of hydrochloric acid will be set-up one with no concentration(water), one 5 cm3 of hydrochloric acid with 5 cm3 of water(50% acid concentration) and one 10 cm3 of hydrochloric acid(100% acid concentrated) and with acid concentration 25% and 75% each will be measured for weight. 5 different large sized chips will be measured out till approximately 2 grams in weight each and added to the weighed out test-tubes. The stop-watch is then started after 3 minutes the test-tubes are weighed and the difference in weight is the amount of solid dissolved by that certain concentration of acid and how much gas was given off.
Apparatus needed: - 5 test-tubes
- Hydrochloric acid
- Calcium carbonate chips
- Stop-watch
- Scales
Fair and reliable tests:
The results will be made reliable by repeating the experiment until there is a fixed result e.g. 4.2, 4.3 and 4.2. At least 3 tests will be done.
The investigation will be made fair by keeping ever variable constant expect the concentration of the acid so temperature, amount of catalysts and surface area will be kept constant. These variables will be kept constant, surface area will be kept constant by using large chips and the same amount(5 grams) and overall the surface area will be approximately the same, temperature will be kept constant by always doing the experiment at room temperature and the amount of catalyst will be kept the same as no catalyst is used.
Range
I'm using the range from no concentration to full concentration and 3 in the middle of these 2 (25%,50% and 100%). I'm using this range as it has two extremes and there are enough different concentrations to get results to make a valid graph.
Safety Precautions
For there to be enough safety too complete this investigation without problems safety specs need to be worn. Long hair and ties need to be kept away and tied back from Bunsen's. Hydrochloric acid can be dangerous so will be used with care.
Preliminary Results
I tested the 2 extremes e.g. 100% concentration of acid and no concentration of acid and received these results:
Concentration
Mass of carbonate chips at start/g
Mass after 3 minutes
Mass loss/g
00%
5.01, 5.03, 4.99
3.50, 3.45, 3.46
.51, 1.59, 1.55
0%
5.01, 5.00, 5.03
5.01, 5.00, 5.04
0.00, 0.00, 0.01
Did It Work
I tested my 2 extremes to see whether the ranges in the middle would work. One of my 0% concentration of acid(water) mass of the carbonate chips went down from 5 grams to 5.01 even though water and calcium carbonate should not react this may have been because when the carbonate chips were measured to 5 grams they were dry but when measured again the chips were slightly damp so the weight went up slightly.
Amendments
There is just a few scales in my class so I could not keep my solution of calcium carbonate and hydrochloric acid on the scales for 3 minutes so I had to alter my method instead of measuring the amount of gas given of I'm going to measure the change in mass of the calcium carbonate chips by placing 5 grams of calcium carbonate into the acid and after 3 minutes I tip out the calcium carbonate chips remove the acid and but water on the carbonate chips to stop further reactions. I then measure how much the calcium carbonate chips have decreased in mass. Also in my method I was going to use 10 cm3 of acid but in my preliminary results this was to slow a reaction so I have changed it to 50 cm3.I was going to use 2 grams of carbonate chips but this was not enough so I'm going to use 5 grams of carbonate chips.
Final Method Used
A measuring cylinder had a solution measured out, for example if a concentration of 25% acid was to be tested then 12.5 cm3 of hydrochloric acid and 37.5 cm3 of water was added to this give a 50cm3 solution with 25% concentration. 0%, 50%, 75% and 100% concentrations of acid were also measured out. Once a concentration of acid was measured out it was added to a conical flask. 5 grams of large calcium carbonate chips were measured out. The chips were then added to the conical flask with a certain acid concentration inside. Once the chips were in the certain acid concentration a stopwatch was started. The reaction was left for 3 minutes. In a sink some tissues were placed these allowed the reacted solution through and down the sink but not the chips. Once the reaction had gone 3 minutes it was tipped onto the tissues in the sink the solution then went down the sink leaving the reacted chips on the tissue. A squirt of water from the tap removed left over concentrated acid the chips were then picked up and re-measured and the mass lost from 5 grams is the amount of calcium carbonate chips had been reacted with as the reacted calcium carbonate chips give off gas. This is repeated until a fix result appears for each concentration.
Apparatus:
Apparatus needed: - test-tubes
- stop-watch
- calcium carbonate chips(large)
- conical flasks
- hydrochloric acid
- scales
Results Table:
?
Concentration
of acid
Mass of
calcium carbonate
chip at start /g
Mass of
calcium carbonate
chips after 3
minutes/g
Any anomalous results (not counted in average)/g
Average
of mass of calcium carbonate chips
lost /g
5.00
5.01
0% (All water)
5.00
5.00
0
5.00
5.00
25% (12.5 cm3
5.00
4.64
acid, 37.5 cm3
5.00
4.65
4.32
0.35
water[0.5 mol])
5.00
4.67
50% (25 cm3
5.00
4.24
acid, 25 cm3
5.00
4.26
0.72
water[1 mol])
5.00
4.33
75% (37.5 cm3
5.00
3.85
acid, 12.5 cm3
5.00
3.86
3.36
.15
water[1.5 mol])
5.00
3.84
5.00
3.51
00% (all acid)
5.00
3.52
.48
[2 mol]
5.00
3.52
In my results table I have written 5.00 grams for my measurement of calcium carbonate chips before reaction as I only have half my measurements and then accidentally forgot to write the rest down.
Average mass loss was found by adding my 3 closest results, so excluding anomalous results, they were then divided by 3 and rounded up to the closest whole number. e.g. for my 100% concentration I received 3.51, 3.52 and 3.52 as my results so I added these together giving 10.55 this was divided by 3 giving 3.5166667 and this was rounded up to the closest number that is 3.52. To then find mass loss the average mass loss was taken away from 5 e.g. 100% concentration 3.52 was taken away from 5 to give 1.48.
I received 2 anomalous results in my experiment which I did not count in my average. For 25% I received 4.64, 4.65, 4.67 and 4.32 these results are close together except for 4.32 which is very wrong also for 75% I got 4.84, 4.85 ,4.86 and 3.36 these results are very close together except 3.36 which is completely wrong later in evaluation I will look why I received these anomalous results.
Results table showing rate of reaction:
Concentration
Average of mass
loss /g
Rate of reaction/g/min
(mass loss/3)
0% (0 mol)
0
0
25% (0.5 mol)
0.35
0.12
50% (1 mol)
0.72
0.24
75% (1.5 mol)
.15
0.38
00% (2 mol)
.48
0.49
I used the range 0% to 100% with 25%, 50%, 75% in the middle this range worked and my at first look seemed correct. I received a couple of anomalous results so repetitions were made here and for each concentration I got 3 results that were similar and it was only the 25% and 75% were a couple of my results were out.
I worked out the rate of reaction by dividing the difference of the masses from the start of the reaction to the mass of the carbonate chips at the end of the reaction and divide this by time taken which is 3 minutes.(this is shown in table above). For example for my 100% concentration the carbonate chips started at 5 grams after 3 minutes had decreased to (on average) 3.52 giving a decrease of 1.48 the 1.48 is divided by 3 (3 minutes) to give a rate of 0.49 grams per minute.
What the graph shows about rate
The line of best fit on my graph goes up very obviously in a straight line. This shows that the higher the concentration the higher the rate of reaction. Also the line of best fit shows the results to be proportional e.g. if you double the variable(concentration) the rate id double. The line of best fits shows the results to constantly rise and tells me that the higher the concentration the higher the rate.
Is there a quantitative relationship
The graph does show a quantitative relationship for example at 25% concentration the rate is 0.12 g/min and at 50% concentration which is double the rate doubles to 0.24 g/min and at 100% which is double 50% the rate should be 0.48 g/min is my result gives it to be 0.49 g/min which is only slightly out so the quantitative relationship is if you double the variable(concentration) the rate will double.
Do the graph prove my theory to be right
My theory was that the higher the concentration the higher the rate and that there will be a quantitative relationship that if you double the concentration the rate will double. I explained why this happens, the rate increases when the concentration is increased because when the concentration is increased there will be more particles in a certain area(cm3) in my experiment it was in a volume of 50cm3 so as there are more particles collisions are more likely to happen so the more collisions the faster the rate of reaction. My quantitative reaction showed that when you doubled the concentration the rate doubled this is because there is twice as many particles in the same volume(50cm3) so more there are twice as many collisions so the rate increases by double.
Do the results support my prediction
My prediction was that there would quantitative relationship that if you double the variable(the concentration) the rate and the mass loss will also double. I predicted that at a 0% concentration there will be no concentration and this was proven correct. I predicted at 25% the mass loss will be 0.5 grams I was out as it was actually 0.35 grams at 50% I predicted a 1 gram change in mass but was out again as the result came out to be 0.72 grams. At 75% concentration I predicted a mass loss of 1.5 grams when it was actually 1.15 grams and at 100% I predicted a 2 gram mass loss but was wrong as it came out to be 1.48. I made these predictions by guessing 25% concentration and then through the quantitative prediction that I made calculated the other results and if I had guessed 25% correctly my other results would have almost have been completely correct as the experiment did fall into the quantitative relationship that I predicted.
Were the results accurate, if not then why?
My graph shows my results to be accurate as my line of best fit runs through or very close to my results. My results are accurate but not exact and for my graph I used an average for mass loss and did not include 2 anomalous results that I received if I had include this my line of best fit would not run through most of my results. My results may have been slightly inaccurate because temperature and surface area are difficult to keep constant. I could not keep surface area constant and only rough groups were given (large and small) I used large each time a made the amount of chips to be 5 grams and each time using chips from the large group to keep surface area constant as possible also temperature could not be kept constant as I could not do all my experiment in one day and so the temperature I was doing the experiment at changed from day to day so caused some inaccuracy. Also i had to use a measuring cylinder to measure out the concentrations of the acid and water solution and measuring cylinders could cause some inaccuracy to the amount of water and acid. My anomalous results may have been because of temperature, surface area or the inaccuracy of a measuring cylinder but were so far out each time that it must have been down to another factor, maybe that I measured out the wrong concentration or I forgot to zero the scales before measuring the loss in mass or a chip was lost down the sink or got stuck in the tissue on of these factors meant that I received a result much further out than others within that concentration. All these factors meant my results could not be exact. I have made a computerised a graph of what my graph would have looked like if I had counted my anomalous results. The green line (average results excluding anomalous results) is very straight but the red line (average results including anomalous results) is very bent and a line of best fit would be hard to draw.
Range of inaccuracy:0% - 5.00-5.01- inaccuracy of 0.01(good)
including anomalous 25% - 4.32-4.67- inaccuracy of 0.35(bad)
50% - 4.24-4.33- inaccuracy of 0.09(okay)
75% - 3.36-3.86- inaccuracy of 0.50(very bad)
100%- 3.51-3.52- inaccuracy of 0.01(good)
Graph to show difference between if you count anomalous results and if you don't:
Difficulties with method
My first method contained many difficulties, e.g. not enough scales, not enough acid or chips. My final method worked a lot better but still had difficulties. Measuring cylinders made inaccuracy very likely e.g. for 25% concentration I had to measure out 12.5 cm3 of acid this was very difficult to do as the measuring cylinder only used whole numbers (12,13,14 etc) so inaccuracy was likely here. Surface area was also difficult to keep constant and could only be approximated also temperature was also difficult to keep constant. All these factors meant the results could not be precise. Another difficulty was dropping the carbonate chips into the acid concentrated solution and starting the stopwatch each time the delay was different so inaccuracy was possible here. Also occasionally the smaller chips could get stuck within the tissue causing the result to be inaccurate by a small amount.
Could I achieve my aim
With all the factors that could make the experiment inaccurate I was able to receive without counting the anomalous results a very accurate graph with a good best fit line. I used the largest range possible so was able to fulfil my aim. My aim was to see whether a change in variable would change the rate of reaction and my line of best fit shows that when the concentration is increased the rate also increases. The graph also shows a quantitative prediction so overall does prove my aim.
Could my method be improved
My method did gain some accurate results but could be improved is several ways like if there was more time available then more repetition could have been made to get the results exact as possible. The measuring cylinder caused inaccuracy which could have been eliminated if a pipette or a burette could have been used. Surface area is very hard to measure but perhaps exact cylinders of carbonate chips could have been used or they could have been cut into squares where then the surface area could be easily measured and put into more exact groups. Temperature is very difficult to keep constant the only way to do this is to somehow heat the room to the same temperature each time but is very difficult to keep constant.
Is there enough results
The results I got from the range and method were enough to get a reliable line of best fit on a graph and does show a very clear relationship between amount of the variable and the rate of reaction and also shows a quantitative relationship. With more time I could have increased my range I choose the furthest extremes I could but in the middle I only had 25%, 50% and 75% so more concentration could have been achieved with more time, for example 33%, 20%, 80%, 60%, 66%, 40% could also be measured.
Could other results be found or could the investigation be extended
To find other results another method could be used for example how the change in concentration would do to the volume of gas produced as with slight adjustment to the original method this could be achieved. All the difference will be is to instead of leaving acid concentrated to react with calcium carbonate chips and then measuring the mass loss the reaction will be connected up to a gas syringe and after 3 minutes the amount of gas produced will be measured.
The same method could be extended by using a different, stronger or weaker acid and the calcium carbonate chips could be replaced by other substances ones more or less reactive. Instead of a concentration made of 50cm3 you could use concentration using 100cm3 and see if the rate just doubles for each concentration.