Execution Procedure
By my Preliminary work, I will estimate five temperatures to measure, with three repeats for each. These will be at 10°C, 15°C, 20°C, 25°C, 30°C and 35°C
I will use two similar methods depending on whether the temperature is above or below room temperature.
-
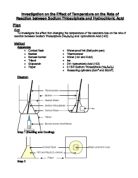
If the temperature required is above room temperature, I will set up the experiment as it is on the left of Step 1 of my diagram. Otherwise, I will set it up as it is on the right of the diagram. The 50cm3 of sodium thiosulphate will be measured with the 50cm3 measuring cylinder.
-
I will also measure out 5cm3 of hydrochloric acid with the 5cm3 measuring cylinder
- I will heat the water and flask inside until the sodium thiosulphate is at the required temperature.
- Keeping the thermometer in the flask to monitor temperature change, I will remove it from the water and place it on the cross as it is in Step 2
- I will pour in the hydrochloric acid, and simultaneously start the stop watch
- Once the cross becomes obscured from vision, I will stop the stopwatch, and note the time
- Since I will re-use the conical flask, I will then carefully wash it to remove any remains of the reactants from it.
Theory
The reaction between sodium thiosulphate and hydrochloric acid can be shown as:
In this reaction, both the sodium thiosulphate and hydrochloric acid are clear. However, the produced Sulphur is yellow in colour, making the solution cloudy in appearance.
Reactions occur do to the collision of particles, this being called collision theory. This is true in this case. Therefore, to increase the rate of reaction, you have to increase the amount of collisions. There are three ways to increase this in liquids: increase the speed of the particles, increase the concentration of particles, or use a catalyst. To change the concentration, the molar density of the reactants would have to be changed. However, temperature can be used to increase the speed of the particles. This is because heating the solution gives the particles more energy. This energy is used by increasing the speed of movement or vibration of the particles. Thus, increasing the temperature will increase the rate of reaction. According to the theory, for every 10°C change, the rate of reaction should double.
The rate of reaction can be measured in arbitrary units of seconds-1. This would mean that as the rate increased, the time taken would decrease. Therefore, increasing the temperature would decrease the time.
Prediction
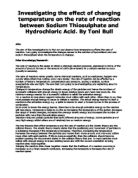
Based on the above theory, I predict that as the temperature increases, the rate of reaction will increase and the time taken will decrease. A graph made of the rate should therefore be exponential, as doubling would result in a graph of y = a(2x). I therefore predict a graph like this:
Analysis
Results
I was only able to repeat each temperature twice, due to time constraints. I also chose not to average the results of the same temperatures, as a slight wavering in the temperature could have resulted in a relatively massive change in the time/rate.
Also, by using the fact that the rate should double every ten degrees, I was able to make a theoretical set of results. I calibrated this according to my 25°C result, as it was the same both times and therefore the most reliable with concern to accuracy. From these I was thus able to get the predicted time, as the reciprocal of the rate. The results table as follows is this:
Analysis
There are two related pieces of information that can be deduced from this table: the time and the rate, both of which can be compared to their theoretical counterparts. However, since it is the rate that we are interested, I will only briefly mention the former.
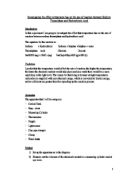
The graph for time is as follows:
As you can see, the time decreases as the temperature increases. The graph curves, due to the fact that, in short, it has to, as it has to be asymptotic to Time = 0: the time can never be 0; or any value less for that matter. Also, the real and theoretical lines are quite close, showing that the results are quite reliable.
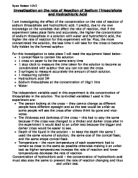
The rates graph, as show next, is more important for the analysis. Firstly, I will compare it to my prediction. The best way to do this would be to overlay the prediction graph onto the rates graph, and find any similarities.
As you can see, my prediction is correct. As I had predicted, the rate does rise exponentially. There is some difficulty in comparing the two graphs, as I had not investigated nor anticipated a temperature of 0°C, which I had included in my prediction. In theory of course, the rate of reaction would then be 0, as the reactants would be frozen: however I have no practical evidence to this theory. However, the graph agrees with the prediction to the extent of temperature affecting the rate of reaction directly, and that the increase in the rate of reaction increases with the temperature. This can be coupled with the similarity of the real line to the theoretical line, which I believe is evidence enough that this increase is exponential. Therefore I can conclude that an increase in temperature exponentially increases the rate of reaction.
Evaluation
This experiment’s accuracy was quite high due to the fact that there were repeats. The accuracy would however have been increased had I done more repeats. However, this was not possible due to time limitations.
I believe that, except for the temperature and cross technique, the experiment was as accurate as they could have been in the circumstances. The correct measuring cylinders were used for the subject, and a stopwatch was used for the time, recording it to the nearest second as I believed that this was an adequate degree of accuracy due to the inaccuracy of the aforementioned cross and temperature.
As you can see on the graph, there were few anomalous results in that the repeats did not agree with each other. However, the pairs of results at 20°C and at 30°C are both anomalous from the line of best fit. This, and any other errors, could be explained by two things. One would be a human error such as speed of pressing of the stopwatch or checking the cross. Also, due to practical conditions, the cross used was not always the same, which would explain why the anomalies come in pairs. Also, the exact time the cross had disappeared would have been subject to debate.
Another error would be inconsistency in the temperature: it is difficult to get a temperature exactly, and even more difficult to keep it constant. In fact, this could be used to explain the divergence of the lines: at higher temperatures, the solution cooled more quickly, resulting in a lower rate of reaction overall. Also, only the sodium thiosulphate was heated, and the hydrochloric acid was kept at room temperature.
However, even thought there were the aforementioned discrepancies, I believe that the similarity of the real line to the theoretical line allow me to draw conclusions, as I have
Was I to do the experiment again in ideal conditions, I would modify my method significantly. Instead of a beaker filled with hot or cold water, I would use much more exact methods of getting the liquids to a specified temperature, and maintaining it. This could be a water bath, however preferably it would be some sort of enclosed area with the entirety inside heated, and computer controlled based on negative feedback from the liquids themselves, including during their reaction. Also, instead of using a cross, I would prefer to use a more precise method, e.g. a laser and receiver, whereby a low power laser would be shot through the thiosulphate and the reaction would have been considered complete when the receiver received less than a specified amount of laser light. This coupled with an automated hydrochloric release system could be used to measure the temperature exactly, again being computer controlled. This would eliminate human error.
Also, I would like to find other factors which affect the rate of reaction. Due to catalysts factor being discrete as opposed to being continuous like temperature or concentration, I would rather do concentration, similarly to how I had done the temperature. Keeping the concentration constant would have proven easier than to manage the temperature.