Investigation to compare quantitatively the concentration of reducing sugars in samples of fresh orange, lemon and grapefruit juice
Investigation to compare quantitatively the concentration of reducing sugars in samples of fresh orange, lemon and grapefruit juice
Introduction - Background Knowledge
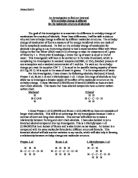
This experiment involves the test for reducing and non-reducing sugars, using the Benedict's test. When a reducing sugar is heated with an alkaline solution of copper II sulphate (Benedict's solution), it forms an insoluble precipitate of copper I oxide. The colour of the precipitate then changes from green through yellow, orange and brown to deep red, depending on the quantity of reducing sugar present.
Any substance providing electrons to carry out reduction is called a reducing agent, which reduces other substances. Benedict's reagent contains copper (II) sulphate. The copper two plus ions from the copper sulphate are reduced by electrons from the (C double bond O or a carbonyl group) found in certain sugars to form copper one plus ions. A resulting changes to copper (I) oxide to form a red precipitate. Therefore the sugars that contribute the electrons are called the reducing sugars. Examples of reducing sugars include glucose, glyceraldehyde, lactose, arabinose and maltose. In general a reducing sugar is any sugar that, in basic solution, forms some aldehyde or ketone.
The idea of a higher concentration of reducing sugar producing a red solution and precipitate, in contrast to the green/yellow solution and precipitate produced from a much lower concentration of reducing sugar is experienced during the Benedict's test. The differences in colour mean that the Benedict's test is semi-quantitative, i.e. it can be used to estimate the approximate amount of reducing sugar in a sample. First of all, a range of colour standards is produced by preparing a series of glucose solutions of known concentrations. To an equal volume of each is added the same volume of Benedict's reagent and they are then heated in a water bath for the same length of time before being cooled to room temperature. An equal volume of an unknown sample is then treated in the same way and the colour compared with that of the colour standards.
The input/independent variable which is going to be changed is the concentration of glucose, and the output/dependent variable which is going to be measured is the colour of the heated concentrations, by using a colorimeter.
However there is no direct test for a non reducing sugar, but they can be identified by first hydrolysing them with dilute acid and then detecting the resulting sugars by the Benedict's test. To measure the actual strength of the colours one can use a colorimeter (is good as it is subjective); this works by sending a beam of light through a filter and then through a sample. The intensity of the beam of light is measured by a photocell. This figure is then displayed on the meter either as the amount of light absorbed (in arbitrary units) ...
This is a preview of the whole essay
However there is no direct test for a non reducing sugar, but they can be identified by first hydrolysing them with dilute acid and then detecting the resulting sugars by the Benedict's test. To measure the actual strength of the colours one can use a colorimeter (is good as it is subjective); this works by sending a beam of light through a filter and then through a sample. The intensity of the beam of light is measured by a photocell. This figure is then displayed on the meter either as the amount of light absorbed (in arbitrary units) or intensity of the light passing through the solution.
To measure the intensity of colour (for instance blue or red) for the Benedict's test is to filter out the brick red precipitate and measure the intensity of the blue copper sulphate solution left. For no light to be absorbed use the most concentrated solution to set the colorimeter to zero. This solution should be pale blue as it contained the most glucose and as a result most of the copper should be reduced. The solution should be of an increasing blue colour and so absorbance should increase as the glucose concentration decreases (a calibration curve should be drawn out).
Prediction:
The samples containing more reducing sugar will turn red, and the ones that contain less will turn green/yellow, or simply stay blue if it contains no reducing sugar at all.
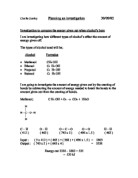
I predict that orange will be the most concentrated (juice), as a result become the most red whereas lemon will be the least concentrated so will be yellow in colour after the experiment is completed. Here is a table below to justify my prediction:
Fruit
Fruit concentration (in the actual juice)
Juice concentration (%)
Lemon
2
2.2
Grapefruit
6
8.3
Orange
1
0.1
We have to convert the % concentrations to mg/cm³ or mg/ml; this is where 1ml = 1cm³ and 1000mg = 1g. Therefore 1% solution is 1g in 100g of water solute (1 cm³ = 1g). The solute 1g in 100ml of water = 1% solution =1000mg/100 cm³ = 10mg/ cm³.
Overall 1% = 10mg/ cm³
Therefore with the new units of concentration worked out the table will look like this:
Fruit
Fruit concentration (in the actual juice)
Juice concentration (%)
Juice concentration (mg/ cm³)
Lemon
2
2.2
22
Grapefruit
6
8.3
83
Orange
1
0.1
01
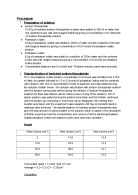
Preliminary Work:
My aim is to design an experiment to compare quantitatively orange fruit, grapefruit and lemon fruit, with respect to the amount of glucose they contain. I will endeavor to make the experiment as fair as possible and aim to minimize the amount of errors.
* First I labelled 5 test tubes (1,2,3,4,5), then using a 10cm³ syringe, I placed 10cm³ of 10% glucose solution in test tube 1.
* Using a 1cm³ syringe, I took 1cm³ of this solution from test tube 1 and placed it in test tube 2. Then using a 10cm³ syringe, I added 9cm³ water to test tube 2 and inverted it to mix the contents. So the 1cm³ of 10% glucose solution had been diluted ten times to make a 1% solution.
* I then transferred 1cm of solution from test tube 3 to test tube 4 and diluted it with 9cm³ water to make a 0.01% solution.
* I repeated this for test tube 5.
* Test tubes 1-4 all had 9cm³ of solution in them, but test tube 5 had 10cm³, so I removed 1cm³ of solution from test tube 5 so that the subsequent test was a fair one.
* Then using a 5cm³ syringe, I placed 5cm³ Benedict's solution in each test tube and placed all 5 test tubes in a thermostatically controlled water bath at 75°C for 9 minutes.
* Removing all the test tubes from the water bath, I returned them to the test tube rack to compare the colours.
Risk assessment:
* Make sure a lab coat is worn, so that if any chemicals spill on you, they will not ruin your clothes and even more importantly will not harm you, or irritate your skin.
* If a substance touches your hands or skin, wash it immediately as it may be irritant or corrosive in turn harming your skin. If it does irritate tell your teacher.
* Be careful of fragile equipment, especially glass and keep equipment away from the edge of surfaces to prevent glass from breaking and any chemicals from spilling.
* Tuck in your stools underneath tables and make sure bags and coats are hung up, so pupils do not trip up or get hurt.
* Follow instructions carefully and if you are not sure ask the teacher to help you to prevent you from doing anything wrong.
* Be careful of the boiling water bath, as it will be hot. Do not directly put your finger in there, as it will burn them.
* Tidy away equipment making sure used equipment is not mixed in with clean equipment, as this will affect other pupil's results when they carry out the experiment.
Results:
Test-tube
Concentration of glucose (%)
Colour observed after Benedict's test (5cm³)
0
orange
2
red
3
0.1
green/grey
4
0.01
blue
5
0.001
blue
Unknowns
A
0
red/orange
B
0.01
blue
Fruit Juice?
0
orange
Apparatus:
Item
Quantity
Concentration & volume
Reason for choice
Glucose solution
0%
It was to be tested
Test tube
2
To contain solutions
Test tube rack
To hold the test-tubes
Pen
To label the test-tubes
cm³ syringe
To put 1cm³ or less into or out of a solution
5cm³ syringe
To put 5cm³ or less into or out of a solution
0cm³ syringe
To put 10cm³ or less into or out of a solution
Water bath
To heat the test-tubes of different solutions
Benedict's solution
5cm³
To turn the solutions blue
Variables:
Variable
Why it must be controlled
How it will be controlled
Timings
Fair test
Using a stop-clock, and placing all test-tubes in one rack so that they are all inserted into and removed out of the water bath at the same time.
Temperatures
Fair test
By everyone putting in their own test-tube racks into the water-bath at the same time and taking them out at the same time, so that heat does not keep escaping, each time somebody else opens and closes the lid, which affects other people's results.
Concentration of glucose
Fair test
By using a Burette - provides more accuracy
Volume of Benedict's
Fair test
By using a Burette - provides more accuracy
Method:
* First of all, I made up a series of glucose solutions of concentrations 0%, 0.5%, 1.0%, 1.5%, 2.0% and 2.5% into 6 different labelled test-tubes.
* I then transferred 0.5cm³ of each of my solutions into another 6 different labelled test tubes. After that, I added 5cm³ of Benedict's solution to each test tube.
* I put all the test-tubes in the thermostatically controlled water bath at 75°C for 9 minutes.
* After removing them from the water bath, I transferred some of each filtrate to a cuvette, by using a pipette, filling the cuvette half-full and making sure I kept them in order, because you cannot label the cuvettes.
* Then by checking that filter no.7 (orange) was in place in the colorimeter, I put the cuvette containing the filtrate starting from 2.5% solution into the colorimeter, setting the colorimeter to zero using this cuvette.
* I took one reading of each of the cuvettes and recorded my results.
Results:
0% glucose
Volume of distilled water (cm³)
Volume of 10% glucose solution (cm³)
Absorbance in arbitrary units (%)
0
0
0
.46
0.5
9.5
0.5
.39
9
.16
.5
8.5
.5
0.62
2
8
2
0.26
2.5
7.5
2.5
0
Analysis:
To work out the concentration of an unknown I would, after gaining the results from my planned experiment, I would use the average of each of the substances, to draw a horizontal line on my calibration curve graph also created from this experiment, where I would then mark where the calibration curve and the horizontal line, marking the amount of light absorbed by the substances (for example orange) and then follow the mark down with a vertical line. From here you can see where this line crosses the x-axis (concentration mg cm3) and therefore be able to tell what the concentration is.
The experiment could be made more accurate with the use of more precise instruments such as burettes to measure volumes; however enough of these were not available at the time. Also the fact that each of the juices has a different colouring makes the experiment even more inaccurate, due to the use of the colorimeter.
There was the problem of the percentage transmissions on the colorimeter fluctuating, therefore there were two or three readings, and so a 100% accurate reading was not taken. Finally another problem was time keeping, because when we placed the boiling tubes in the boiling water bath it was impossible to put them all in at the same time and the same situation occurred when taking them out. Therefore, the time when each boiling tube went in and came out was different, maybe causing some glucose samples having more time to change colour.
This test was quantitative as we measured the cloudiness (turbidity) of the solution using a colorimeter. To extend this investigation making it quantitative I could have also filtered and weighed the precipitate produced. This would have given me an indication of the measurement of the amount of sugar present in the sample.
ANIL VAGHELA 12JFH6