Safety:
I will be carrying out Benedict's test, which will require me to use a Bunsen burner; therefore, I will have to be careful whilst handling it. I will also use goggles to protect my eyes. Furthermore, I will keep the flame away from myself so that I do not come into contact with it. Moreover, when using a boiling water bath I will need to point the test tubes away from myself because the water could be ejected from the test tubes and can burn the skin. Finally, I will be handling glassware; hence I will need to be very careful not to break it.
Variables:
The independent variable will be the sugar concentration, this is the variable I will be controlling and testing its effect on the dependent variable: which is the colour of the precipitate. I will be able to control this variable by using a certain amount of concentration for the solution, this will therefore enable me to acquire the relevant data required to carry out my investigation.
The first constant will be temperature; I will keep this constant for all three solutions, this is so that it is a fair test and will enable me to accumulate my data accurately. I will control the temperature by using a thermometer to determine the temperature; 90oC. I will control this because it will enable me to understand the relationship between the independent and dependent variable. The second constant in this experiment is the Benedict's solution, this will also need to be controlled to make the experiment fair and will show what effect the sugar concentration has on the solution. Therefore, I will be using equal amounts in all three solutions, which is 5millilitres.
The variable which I will not control will be the colour of the precipitate; this will be the dependent variable and is a result of the manipulation of the independent variable.
Method:
1- Label all test tubes by covering with masking tape at the top and writing the test tube number accordingly.
2- Place 10 millilitres of the 10% solution in test tube number 1.
3- Extract 1cm3 of this solution using the same syringe and place in another test tube. Then add 9cm3 of distilled water with the second syringe, thus the second test tube will now contain 1% sugar solution.
4- From the second test tube take 1cm3 of the solution and add 9cm3 of distilled water. The third test tube now contains 0.1% sugar solution.
5- The fourth test tube should contain 10 millilitres of distilled water because it is a control.
5- Place all test tubes (except the control) on the test tube rack and add 5millilitres of Benedict's solution to each test tube.
6- Add 300ml of tap water to the beaker and place on top of the gauze, which will be placed on the tripod.
8- Goggles should be worn at this point.
9- Bunsen burner should be underneath the tripod and turned on. Put it on a high flame.
10- Water should start to boil, measure with thermometer, so that it is 90oC and leave.
11- Using the test tube holder, place all three test tubes one by one in the boiling water bath and time it for four minutes using the stopwatch.
12- After four minutes, using the same test tube holder, take out the test tubes and place them on the test tube racks.
13- Carefully look at test tubes and record results.
Results
Results 2:
Analysis
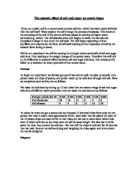
It is clear to see from the results that as the concentration of the sugar increases, the colour of the precipitate becomes more intense. The Glucose acts as a reducing agent and reduces the Copper (II) to Copper (I), hence the change of colour. The colour was more intense for the 10% Glucose solution because there were more sugar molecules to reduce the Copper sulphate. The Copper oxide is insoluble, therefore forms a precipitate and manifests the colour. The 0.1% sugar concentration was not as intense because there were not as many sugar molecules which could reduce the Copper sulphate. The high temperature ensured that the bonds between the Carbon 1 and the Carbon 5 were broken; this consequently opened up the ring structure and enabled the free electrons to reduce the Copper molecules to form a precipitate.
The qualitative data did not enable me to create a valid graph; therefore a superficial graph was created to reflect the overall trend. Additionally, the graph suggested that the relationship between sugar concentration and colour intensity is directly proportional; as the concentration of the sugar increases, the colour of the precipitate becomes more intense. Moreover, the control was compared with the remaining test tubes to show that there had been a dramatic colour change in the sugar solution. The copper-red was put at the top because if this experiment is cross-referenced with the use of a colorimeter, then it suggests that the darker, more intense colour has a higher wavelength, which in this case is copper-red.
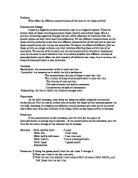
A colorimeter was required to be able to correctly plot a graph and analyse the trends. This is a probe that determines the solution concentration from its intensity. The graph for the increased concentration would show that there was more colour absorption, hence intense colour. If a colorimeter was used it would display the following graph:
In conclusion, the overall trend from the data suggests that the greater the sugar the concentration, the more intense the colour of the precipitate. This is because the higher sugar concentration has more molecules which can reduce the Copper Sulphate to Copper oxide, which forms a precipitate.
Evaluation
The overall reliability of the experiment was increased by repeating the experiment again. A fair test was secured through using equal amounts of Benedict’s solution; this therefore enabled me to infer a cause and effect relationship. The control was affective because it enabled me to compare it to the remaining test tubes to deduce that there was an overall change in colour intensity. Furthermore, the experiment was carried out methodically and thoroughly, which was important to investigate the effect of sugar solution on Benedict’s solution and also make it reliable. Reliability was also increased because the method was replicable, this was important because replicability is an important trait of a science. If this is undermined, then the experiment is not valid. However, an important limitation to the study and which could have affected it was the lack of a colorimeter. The observation was carried out using the naked eye. This would not be an accurate technique because it is difficult to measure the colour intensity of the precipitate without any technical equipment. The colorimeter would be used to reflect the transmittance of the solution. Transmittance is the amount of light that penetrates the solution; therefore a solution with a high concentration will have a higher transmittance. Furthermore, the fact that the experiment yielded qualitative data meant that I was unable to represent the data graphically. This was disadvantageous because it affected the analysis and did not allow me to discuss overall trends in graph. Overall, the results should be treated carefully. The absence of any technical equipment to measure colour intensity proves disadvantageous and does not entirely support the hypothesis. A secure way to support the hypothesis would be to repeat the experiment several times and also use a colorimeter, this would then enable me to make a concrete judgment and will allow me to corroborate my hypothesis. A further source of error whilst conducing my experiment was using the syringes. As I was using only two, I was obliged to use the same pipette for all solutions and the other syringe for adding distilled water. This was not entirely accurate because I was not able to empty all the contents of the solution into the test tube. So if I was making a 1% sugar solution, I would not be adding the full 9 milliliters of the Glucose solution, since approximately 0.5% of this solution remained as droplets in the syringe. This would affect the subsequent solution being made because if a little amount of the Glucose solution remained, then the following solution; 0.1% would not exactly be that but would be approximately 0.2%. The repeats also yield similar results, but are not entirely compatible with the first results. The reason for this can be down to experimental error. As there was no technical equipment such as a colorimeter, it was difficult to measure the colour intensity. Therefore, if compared with a colorimeter, the dark yellow solution may not be that but darker. This would be best measured using transmittance, which would only be possible whilst using a colorimeter.
Changes were also made to the preliminary method, this some apparatus chosen were not suitable. The fist change made was the size of the beaker, this is because the beaker was to large to fit the tripod, therefore a smaller beaker had to be used. Also, I decided to add a control (as discussed earlier).
Further research
If I was conducting the experiment again the fundamental change regarding the experiment would be to add a colorimeter. This would enable me to measure the transmittance of the sugar molecules, as opposed to the colour intensity. Transmittance is the amount of light absorbed, therefore the sugar molecule that absorbs the highest amount of light will have higher transmittance. The following method would be used to carry out this experiment:
Set up the colorimeter by following the instructions below:
- Connect the colorimeter to a power socket.
- Turn it on.
- Set the device at 0% firstly and then at red.
- Open the device up and insert the sugar solution.
- Click on start and it should begin to record he data. The transmittance will be recorded as numbers, for example 450nm.
Beer’s Law can be used to define the concentration of the unknown solution. This is the absorption coefficient for light passing through a solution. It is expressed as I=Io10-cx, where C is the concentration, whilst x is the thickness.