Graphs:
Analysis of results:
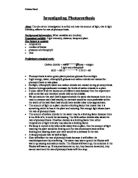
In the graph: ‘to show how the distance of the light from the test-tube affects the temperature’, the best-fit line travels diagonally down and to the right. There is a strong negative correlation in this graph.
This indicates that distance and temperature are inversely proportional i.e. as one goes up the other goes down, in this case as the distance increases the temperature decreases.
In the graph that shows the average number of bubbles against the lamp’s distance from test-tube, the slope goes downwards in a gentle curve, as the lamp is further away from the test-tube. This indicates that the rate of photosynthesis decreases when the light intensity decreases. There is one anomaly in this graph; a more detailed explanation of this anomaly will be in the evaluation section of this investigation.
The table of results indicates that a low distance gives a high temperature and a high amount of bubbles and that the higher the lamp distance from the test-tube is, the lower the temperature and number of bubbles. Therefore temperature and bubbles might be directly proportional i.e. they both rise at an equal rate; to prove this I have drawn the graph below. Anomalies in the table of results include the average number of bubbles at 30cm (which is strangely high compared to at 20cm and 40cm) and the third reading of bubbles at 50cm, which seems to be remarkably lower that it should theoretically be.
The graph that shows the number of bubbles against the temperature indicates, infact, that there is no particular correlation, or proportion. It is a simple curve that gives us two anomalies, both of which are at the temperature of 29 degrees Celsius.
Conclusion:
Variables:
The independent variable: The distance the lamp is from the test-tube
The dependent variables: The rate of photosynthesis is altered due to the distance of the lamp from the test tube. The temperature of the liquid within the test-tube alters due to the distance of the lamp from the test tube. The rate at which the enzymes involved in photosynthesis catalyse is altered due to the alteration of temperature, which in turn is altered due to the change in light intensity.
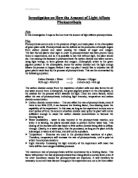
Plants are autotrophic. They use carbon dioxide, water, minerals and salts to build up carbohydrates. They use sunlight as activation energy for this reaction. Oxygen is given of as a by-product of photosynthesis, so we must be seeing bubbles of oxygen gas in the test tube. To prove that it is oxygen gas that is being given off we can test it by collecting it and testing it with a glowing splint (if the splint relights it is oxygen).
The equation for photosynthesis:
Carbon Dioxide + Water Glucose + Oxygen
6CO2 + 6H2O C6 H12 O6 + 6O2
The arrows represent light energy from the sun.
Photosynthesis occurs generally in leaves, this is why we have taken a bright green shoot (The green colour is made by the chlorophyll pigment which is necessary for photosynthesis and is generally found in leaves) because without the green colour no chlorophyll would be present and so photosynthesis cannot occur.
We used sodium hydrogen carbonate to give the plant optimum conditions to photosynthesise in. Sodium hydrogen carbonate solution is in affect, water with added minerals, salt and lots of Co2. We did this because the plant has been cut from the roots and rest of the plant where these chemicals would be absorbed through. The results seem to support our hypothesis.
EVALUATING EVIDENCE
General statement:
We had predicted that with a greater light intensity the rate of photosynthesis would increase. As far as the experiment was continued, we have indeed learnt that the rate of photosynthesis increases as the light intensity increases. Although if we had continued further we may have found that at a certain light intensity the plant begins to photosynthesise so quickly that it may saturate (fill up with glucose to the extent that no more is needed).
Evaluations & Further Work:
We obtained our evidence through observing the bubbles, however this may not be accurate because some of the oxygen may have dissolved. Dissolved Co2 would have gradually decreased, which would quickly make carbon dioxide a limiting factor. There is a possibility of minute creatures decomposing the pondweed, which used up some oxygen. Because of distance, background light or a diversion of light could affect results. To overcome light diversions the experiment could have been done in a dark room, or with a black sheet behind the test-tube.
Overtime a plants rate of photosynthesis is reduced because of saturation; this can pose a problem because it makes the rate of photosynthesis an inconsistent factor. Many bubbles snag underneath leaves, or settle on the side of a test tube making this an unfair test.
Heat at higher intensities could have disrupted results, particularly at a shorter distance away, by destroying or denaturing the enzymes involved. Another factor that poses possible problems is that some bubbles vary in size and can be very difficult to see, especially when the light from the lamp is being reflected by the test tube. One of the dependant variables; the temperature could have been better if it was controlled somehow; instead we have too many dependant variables to make a simple, fair experiment. E.g. if a constant of 30 degrees Celsius was kept by a form of heater, when the lamp was moved away the temperature could not decrease.
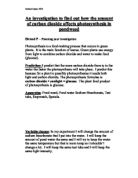
A more accurate way of doing this experiment could be to measure the oxygen released rather than counting bubbles like the diagram below:
Errors:
One substantial error we faced was that when the thermometer was placed inside the test-tube, it pushed aside the plant and rubbed against the side of the tube, dislodging any bubbles that had snagged, and sending many bubbles up to the surface at a rate at which we could not count the amount. Also the thermometer was touching the bottom of the test tube so it was taking the temperature of the glass and the liquid because we did not suspend it.
Anomalies:
The anomalies on the graph to show the relationship between Temperature and bubbles are both on the 29-degree line that means that it is possible that the test-tube may have magnified the temperature slightly or that at this time some form of reaction took place and caused the temperature to rise. The reason both of these results are anomalies is because on the graph there is a large gap between 55.6 and 39.6 bubbles, pushing them off the best-fit line.
The reason there is an anomaly on the graph to find out how the average number of bubbles is affected by falling light intensity is because; the rate of photosynthesis dramatically drops at one point and the anomalous result is at a point before the drop, that does not fit on the curve.
Anomalies on the results table are only because of the plant’s rate of photosynthesis, perhaps at a point the plant did not absorb enough carbon dioxide, or was low on glucose and starch in some areas and began to photosynthesise more rapidly than before.
Improvements:
Putting a clear Perspex cover to absorb heat from the lamp to avoid a change in temperature. Oxygen could have been measured by using a syringe. A black piece of paper could have been used to block background lighting. A different piece of pondweed should have been used for each experiment as the rate of photosynthesis slowly decreases. However it would be extremely difficult to find another specimen of pondweed with the same surface area!
BIBLIOGRAPHY
References:
Jones & Jones, M & J (1996) “Biology”, Cambridge.