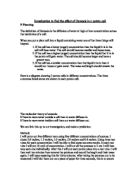
Diagram:
Prediction:
Using the theory of osmosis I can make a prediction to what effect in mass and length shall happen to each potato, when put in different concentrations.
2.0 molar - the mass and length should both decrease, because there is less water outside the potato than in.
1.5 molar - the length and mass should both decrease, because there is also less water outside the potato than in.
1.0 molar - the length and mass of the potato should stay about the same, because there is about the same amount of water inside the potato than there is outside.
0.5 molar - the mass and length of the potato should increase. This is because there is more water outside than in.
0.0 molar - the mass and length of the potato should increase, this is because there is more water outside than inside.
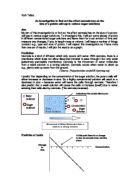
Below, a graph to show the percentage increase and decrease of the mass of the potato.
With my results I should be able to calculate the concentration of sugar found in a potato piece.
O obtaining evidence
Results: Table to show the change in mass (g) of the potato when put into different concentrations of sugar (M).
Results: Change in length of the potatoes in different concentrations of sugar.
A Analysing
See graphs next pages.
In my results I found out that my prediction that I made are mostly correct:
“2.0 molar - the mass and length should both decrease, because there is less water outside the potato than in.
1.5 molar - the length and mass should both decrease, because there is also less water outside the potato than in.
1.0 molar - the length and mass of the potato should stay about the same, because there is about the same amount of water inside the potato than there is outside.
0.5 molar - the mass and length of the potato should increase. This is because there is more water outside than in.
0.0 molar - the mass and length of the potato should increase, this is because there is more water outside than inside.”
The percentage increase and decrease for the graph was worked out by finding percentage change. I averaged my three sets of results to find an accurate result for the percentage change.
Percentage Change =change _ 100
Original
can see comparing the two graphs, in my prediction and as a part of my analysis, that my predicted results are the same. Using the graph In my analysis I can find the approx. Sugar concentration of sugar. To find this I see where my line of best fit crosses the line. See graph*
Comparing the prediction graph and the result graph there is a change. In the prediction the line of best fit goes exactly though 1M as it hits the y-axis I have found from my results that the line of best fit does not go through at this concentration but at 0.7M. This is the concentration that I have found to be the concentration of the potato.
Using the Osmosis theory I have found that the concentration of the potato is 0.7M. That the amount of sugar and water in a cell are not even to each over, in fact there is more water inside a potato cell than there is sugar.
Another thing that I can find out looking at the graph is that percentage decrease slows down, this is because there is a limit to how much a potato can decrease/increase in mass. The potato can only lose the amount of water that is in the potato the potato has its own mass which cannot be reduce. Also in the same way there is a limit to how much the cells of a potato can hold in water.
E Evaluating
I am pleased with the results that I have achieved using my method though the final result is not as accurate as I would have liked. Using my results I worked out that the concentration of a potato os 0.7M but the approx of a potato is in fact 0.3M.
There were no anomalous results.
I can see that it is not anything to do with my results being a bad average because my ranges between the three results were not large (see graph paper). But the following things could have made my results inaccurate:
- Perhaps I did not let the scales when measuring get to zero before measuring.
- Or perhaps I did not blot the potatoes enough.
These things could have gone wrong because there was not a lot of time for measuring the length and mass. I had to move quickly and I was in a great rush to carry out my experiment. I gave up measuring the length because the results did not change like the mass did. I was not able to get an accurate result.
My results are firm enough to support one conclusion:
The molecular theory of osmosis:
If there is more water outside a cell than in water diffuses in.
If there is more water inside a cell than out water diffuses out.
What would I do to improve my experiment?
To improve my experiment I would take more time to do my work and ensure that I took my reading at exactly 10, 20, 30 min.
I would not measure change in length, I was unable to get results which would give me detailed results. Though my results did agree with my prediction.
I could look under a micro-scope and count cells and see what shape they become at different times while being inside the concentrations.
In a further experiment I could Look at a different fruit/vegetable to see if I could get different readings, or even use an egg.
I could later Investigate whether the change in mass differs from each part of the potato, would it effect my results?