Water Molecule
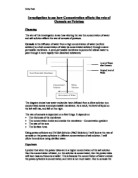
In plant cells, the cytoplasm and the cell sap in the vacuole contains salts, sugars and proteins, which effectively reduce the concentration of free water molecules inside the cell.
If the cell is surrounded by water or a more dilute solution than its content, water will pass in to the vacuole by osmosis. The vacuole will expand and press outwards on the cell wall. This makes the plant cell turgid as the vacuole is exerting turgor or osmotic pressure on the cell wall. If the cells are turgid, the plant will be firm and straight.
- There is a lower concentration of water in the cell sap
- Water diffuses into the vacuole
- This makes it push out against the vacuole
If the cell is surrounded by a more concentrated solution than its content, water will pass out the vacuole by osmosis. The vacuole will lose water, making it become smaller, and soon will lose its turgor and becomes flaccid. The cells are said to be plasmolysed.
- There is a lower concentration of water outside the cell sap
- Water diffuses out of the vacuole
- This makes it shrink, pulling cytoplasm away from the cell wall, leaving the cell flaccid.
This is what I predicted in the hypothesis will happen to the potato cylinders during the experiment.
Apparatus List
Here is the apparatus list of all the items needed in this experiment:
- Potato
- Borer
- Cutting Tile
- 6 Boiling Tubes
- 1M Salt Solution
- Boiling Tube Rack
- Weighing Scales
- Marker Pen
- 2 Measuring Cylinders
- 2 Burettes
- Scalpel
- Ruler
- Distilled Water
Possible Experiment Variables
Here are the possible variables that could have been investigated in this experiment.
- Concentration
- Surface area
- Temperature
The chosen variable is concentration, because this is easy, efficient and can produce good results. The other two would be very hard to investigate and measure, so concentration will be investigated.
The Experiment Constants
The test will be a fair test because most of the factors that will be kept constant in the experiment. The following factors will be kept constant:
- Length of Potato cylinders
- Temperature – which is room temperature
- Apparatus used for each experiment
- Total Volume of Solution
- The Experiment room
- Source of Salt Solution for each experiment
- Scales used to weigh the potato chips
- Potato
- Light Intensity
By keeping these things constant the experiment will be a fair test, and will be able to give accurate answers.
The Experiment Variables
- Concentration of Salt Solution
- Mass of Potato – Only change in mass is needed so this does not matter
The concentration varies, as this is what we are testing. The mass varies as the mass cannot be kept constant, but this does not matter because only the change in the mass is need.
Here is the Suggested Method for the experiment:
Suggested Method
- Collect all the apparatus identified in the list.
- Take the boiling tubes, and label them from 1 – 6
- Using the Cork borer make 3 cylinders for each tube, so make 18 cylinders in total making sure they are all the same lengths. The lengths will be measured using a ruler, and the excess potato cut of using the scalpel. It will be cut on the tile, for safety reasons.
- Weigh 3 cylinders on the weighing scales, note the values in the results table and then place them in the tube. Repeat this for all 6 tubes.
- After, placing the potatoes in the tube, place them in the boiling tube rack.
- Then add the specified amount of salt solution and water in each tube by measuring them with 2 separate measuring cylinders. Using a burette add the specified amounts. Make sure that the amounts added in the labelled tubes are in accordance to the specified amounts in the diagram table below.
- Put the rack in a suitable place away from danger of being tampered with.
- Leave the rack for 24 hours in the same place for osmosis to occur.
- After 24 hours take each tube, and empty the solution contents in a sink. Weigh each potato in it. Note down the results in the results table. Repeat this for all the tubes.
- Wash all the equipment away and put it back in the appropriate.
- Find the average mass for the 3 potatoes in each tube and note that down in the results table.
- Calculate the mass gained or lost by subtracting the mass before from the mass after
- Repeat the whole experiment to double-check the results found.
Diagram
Here is a diagram of how the experiment will be carried out.
Diagram Table
Here is the table that will be used to see what tubes have what amount of salt solution and water.
(The tube numbers will be written in the results table instead of the whole solution contents. For example Tube 1 will indicate that the tube has 10cm3 of Salt Solution)
Here is my planned results table that I plan to use for my experimental results.
Before After
Gain or Loss
Obtaining Evidence
During the experiment I had to made alterations to the method. The alterations I made have been outlined below:
- I washed the potato before using it, and dried it with a paper towel.
- I had to use test tubes as the boiling tubes were too large
- I had to put the test tubes in a beaker because there were not enough test tube racks
- I did repeat the experiment but the second time the results had to be taken at a different time period – only after 2-3 hours due to time. The first experiment results were taken after about 18 hours, which is why the results in Experiment 2 may be anomalous.
- The same apparatus could not be used as the experiment was done after a few days.
- The same temperature could not be kept as the room temperature differed from experiment 1 to 2.
Precautions
These are the safety precautions that were carried out to ensure that the experiment was safe:
- The scalpel and cork borer was used to cut the potato on the white tile, so nothing is damaged
- The tubes were kept in a beaker so that the tubes could not be tampered with
- They were left untouched so the results would not be affected
- The beaker of test tubes was put near the wall, on the desk so that the tubes would not fall of the desk.
Here are the results tables for Experiment 1:
Results
Before After
Gain or Loss
(A negative number indicates loss)
Here is the results table for Experiment 2:
Before After
Gain or Loss
(The average values were rounded up to the nearest decimal)
These were the results obtained from experiment 1 and experiment 2.
Analysing Evidence and Drawing Conclusions
Using the results of average mass lost and gained, in the tables in the Obtaining Evidence Section, I will now produce graphs to represent this data in a more simple way.
The graph has been done using positive and negative axes. A loss in mass is indicated in the negative axes, and a gain has been indicated in the positive axes.
The graphs are shown below.
Here is the graph for Experiment 1:
Here is the graph for Experiment 2:
Anomalous Results
Analysis – Experiment 1
The results found in Experiment 1 are analysed below.
The results for the potato tubes in 0% and 20% salt solution are quite reasonable results, but the result for 40% is inaccurate. As there is more water outside the potato than inside, water should be taken in. this therefore will mean that the mass should increase, but in this case it has not. This is therefore an anomalous result, and is a flaw in the experiment. This could have happened for numerous reasons, which will be discussed in further detail in the Evaluating Evidence Section.
The results found for the potatoes in 60% and 80% salt solutions are quite reasonable again as they have lost mass which is what was meant to happen. However, the rest for the potatoes in 100% Salt solution are not accurate, as they should have lost more mass than the potatoes in 80% salt solution.
The graph should be a straight line of best fit not going through the origin. The results for Experiment one are similar, to the results expected but have some anomalous results, which have been highlighted above.
Analysis – Experiment 2
The results found in Experiment 2 are analysed below.
The results for the potatoes in 0% salt solution are quite good, but the results for the potatoes in 20% and 40% salt solution are not. They could be counted as anomalous results as they do not follow the pattern required and discussed in the analysis for the first experiment. The potatoes in 20% salt solution have gained too much water, while the potatoes in 40% salt solution are similar to results in the first experiment.
The last anomalous result is for the potatoes in 80% salt solution. The amount of mass lost is too little, and should be higher than the potatoes in 60% salt solution, but is not.
There are many possibilities for the anomalies, which will be discussed in detail in the Evaluating Evidence Section.
Conclusion
To conclude, I have determined that all the potatoes did go through the process of osmosis, as they have either lost or gained mass.
Although the results are not as accurate as I would like them to be, they do prove the hypothesis right.
As I predicted, when the potato tubes are in a lower concentration of salt solution than the concentration of water, then the potato will gain mass, and it did gain mass in the experiments, apart from a couple of anomalies.
As I predicted, when the potato tubes are in a higher concentration of salt solution than the concentration of water, then the potato will lose mass, and it did lose mass in the experiment, apart from a couple of anomalies.
This happens because all living plant cells go through a process of osmosis. Osmosis is the diffusion of water from a high concentration of water (a dilute solution) to a low concentration of water (a concentrated solution) through a semi-permeable membrane. A semi-permeable membrane is porous but allows water to pass through it more rapidly than dissolved substances. This is why when the potatoes were in a dilute solution, the potatoes gained water, as the water content in the solution was higher than the water content of their cell sap. The potatoes became turgid. The potatoes in the concentrated solution lost water. They lost water because they were in a low water content solution compared to that of their cell sap, so lost water through osmosis. In this case the potatoes became flaccid or plasmolysed. This is all explained in the Background knowledge section in the Planning section.
Below is a diagram of what happened during the experiments:
Here is an example of what happens when the potato is in a very concentrated solution.
(Diagram not to scale or proportion)
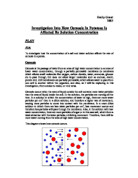
In this diagram, the water molecules are moving out of the potato, and in to the solution though the semi permeable membrane (cell wall). This happens due to osmosis, which is where water moves from a dilute solution to a concentrated solution through a semi permeable membrane. The salt molecules are too large to move, and so hardly cross the membrane, as the membrane only allows small molecules like water through.
This is what happened during the experiment with the potatoes in a concentrated solution.
(Diagram not to scale or proportion)
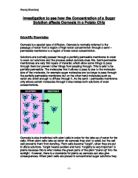
In this diagram, the water molecules are moving in to the potato from the solution though the semi permeable membrane (cell wall). This happens due to osmosis, which is where water moves from a dilute solution to a concentrated solution through a semi permeable membrane. In the potato there is not much water, but there are a few salts and protein molecules. They cannot move across, as the membrane will not allow it to. However the water molecules move across due to osmosis.
This is what happened during the experiment with the potatoes in a dilute solution.
I had also predicted that there will be a point where there will be no osmosis occurring as the water concentration will be equal on both sides of the semi permeable membrane. This is known as the isotonic point. However, though this point could be found, I did not conclusively find it therefore could not answer that hypothesis. However, that could be a point that could be put in the Evaluating Evidence section.
This shows what I have found out during this experiment and shows my conclusions to this experiment on osmosis.
Evaluation
As could be seen the results I found were not entirely correct. Ideally I would like to repeat the experiment once more to ensure the results and conclusions I have made are correct.
There are many factors that I would improve the next time I did the experiment to ensure good results, as these results wee not as good as they could be. This could be for a number of reasons which I have explained below.
As explained in the Analysing Evidence and Drawing Conclusions Section, there were a few anomalous results in both experiment 1 and 2, though the anomalies in experiment 2 were worse than in experiment 1. This could have happened because the experiment though repeated twice, was not left for the same time period for the second experiment. This could have been a possible reason why the results in experiment 2 are not that accurate, due to the time constraints. Next time the experiment would be carried out; I would keep the potatoes for the same time, to ensure data reliability.
Another reason for the inaccuracy of results could be the fact that the apparatus used for both experiments were not the same. This was due to the fact that the second experiment was carried out after a few days, so the same experiment could not be used. This may be another possible reason why the results were not accurate the second time round.
Different potato batches, and different salt solutions were used which may have caused some hindrance to the results. If these were kept the same for both experiments then the results would be better.
The room temperature is similar. As temperature is a possible experiment variable that could have been done instead of concentration, it had to be kept constant. This is very hard to do, so the experiment was carried out at room temperature, but this could have changed between experiments or during experiments. If the temperature were kept constant then the experiment would be fairer and give better results. This could have been done by doing the experiment in a temperature-controlled room, to ensure that the temperature remains constant.
The experiment could also have given better results if I had used more accurate weighing scales, to give better weight readings.
If I were to repeat the experiment I could have possibly found a machine to cut the potatoes. This would ensure that all potatoes would be the same weight and dimensions and make the experiment fairer and give better results.
To find better results, I could also have measured the volume of the solution left when re weighing the potatoes. If this was done, then I could have seen if the volume changes match the mass changes. It would also have provided extra evidence for the accuracy of the results.
In these ways I could have improved my current experiment I carried out.
To extend my experiment I could test how concentration affects the rate of osmosis on different vegetables. I could have used different vegetables, like a cucumber. Then I could find out whether osmosis occurs with the same trends with any vegetable.
I could also have done the experiment with another solution instead of salt solution. I could have used sugar solution, and then compared the two sets of results to see if it makes a difference and why it makes a difference.
I could also have extended this experiment by testing more solutions with the potato cylinders. I could have used more different concentrations of salt solution to give better results in this experiment. By doing this I could have found the isotonic point, which is where osmosis is balanced so there is water movement, as the water concentration is the same on both sides of the semi permeable membrane.
I cold also have tested how the osmosis rate changes with different potato cylinder sizes. From this I would be able to see if the size of the potato affects the rate of osmosis.