I will keep the temperature reasonable the same by doing the experiment all in the same period of time, and using solutions and potato chips that have been kept at room temperature for a long time. I will keep the volume of sucrose solution the same by measuring it out using a measuring cylinder. I will keep the amount of time allowed the same by using a stopwatch to measure out a uniform period of time. I will keep the type of potato and sugar the same by only using the same type, brand and make. I will control the mass of the potato by using a ruler to cut out the same sized chips.
Prediction
I believe that as the concentration of the sucrose solution increases, the potato chip will start to lose mass. This is due to loss of water through the selectively permeable membrane to the higher concentration – the sucrose solution in the beaker. In other words, when the concentration of sucrose solution is nil, the potato chip will absorb a lot of water. However, when the concentration of the sucrose solution is 1 mol, the potato chip will become flaccid through losing a lot of water. This is all because the molecules of a solvent will naturally diffuse into a solution where it is less concentrated, basically a solution of higher concentration (of solute) then the solution it’s currently occupying. I also believe that as the concentration of the sucrose solution increases, then more water will be lost each time period due to the higher contrast of the solutions, e.g.
0.4 mol = x, 0.6 mol = x + 1, 0.8 mol = x+2, etc. Where x = water loss.
This basically means that the larger the difference in the amount of water molecules, the faster that osmosis will take place because there are a greater number of molecules to pass through the selectively permeable membrane.
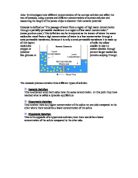
Apparatus: The equipment that I will need to conduct my experiment safely and to the best of my ability condoning the limits of the equipment we our allowed is as follows:
- Scalpel
- Ruler
- 6 beakers
- Stopwatch
- Balance
- Measuring cylinder
- Potato
- Cutting board
- Blotting paper
- Sucrose solutions – 0.2, 0.4, 0.6, 0.8, 1 mole/s
- Distilled water
Method
Firstly, I would take 6 potato chips and cut them into 2cm long pieces, using the scalpel, cutting board and ruler, to measure out the lengths to 2cm. Next, I would take a potato chip and weigh it on the electronic balance, recording the weight in a table. I would then take the measuring cylinder, and measure out 200ml of the distilled water, and pour this into one of the beakers. Thereafter, I would take the same potato chip and drop it into this beaker, making sure to start the timer on the stopwatch the second the potato chip hit the bottom of the beaker. After 2 minutes, I would then remove the potato chip and blot the excess solution off of it, before weighing it a second time on the electronic balance, and then also recording this weight in the same table as before. I would then throw this potato chip away. Next, I would take another potato chip and repeat this process again, except I would use a sucrose solution of the next molarity concentration, in this case, 0.2 mol. Then I would repeat this whole process until I had worked my way through all the different concentrations of the sucrose solution I will be using (0.2, 0.4, 0.6, 0.8, 1.0 mol) and the potato chips I had cut to size. Next, I would take 6 more potato chips and cut them into 2cm long pieces, using the scalpel, cutting board and the ruler. Then I would do the whole experiment again, to get repeat readings of the data I had just collected, using the same concentration of solution that each beaker had previously contained. In-between each measurement of solution, I would rinse out the measuring cylinder and dry it with a paper towel, as to not contaminate the carefully sucrose solutions.
I intend to use 6 different concentrations so as to make it easier to see a trend or pattern in my results, therefore making my results clearer and much simpler to understand. It will also help me find out whether my prediction was right, as well as making it much harder to argue against my hypothesis. This will also raise the standard of my work, increasing it’s credibility. I will repeat my results twice, because it improves the reliability of my results, proving that they weren’t just a fluke, or that I hadn’t made some miscalculation. This again also improves the credibility of my work and makes it much clearer, and easier to understand. In addition, I’m able to find the average of these 2 sets of results, giving me a much more accurate set of data to work on.
Before carrying out the main test, I did a smaller scale version to make the real thing much more accurate in the way that I carried it out. This preliminary test was to get me ready for the main test, though as well as giving me some data with which I can use to support my main test results. Below I have a table containing the results I got from my preliminary test.
M = molarity
These test results were obtained from exactly the same method that I will use to carry out the main test, under mostly the same conditions, so I would expect the results to be similar.
Obtaining evidence
This table below is to show the results of my main test:-
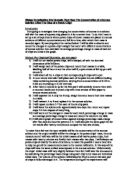
Analysing and concluding:-
The graph above shows that as the concentration of the sucrose solution goes up, the mean percent in mass change also increases. This means that as the higher the molarity of the sucrose solution, the bigger the change inn mass each time. This is what you’d expect to find in osmosis, because as the molarity of the sucrose solution increases, the more water the potato chip loses. This is because there is less water outside of the potato chip then there is in solution inside it, through the sucrose solution being of a higher concentration. Water is then naturally diffused through the selectively permeable membrane back into the sucrose solution, and this will continue until equilibrium is achieved between the two solutions. This supports my prediction of the higher the concentration of the sucrose solution, the more water will be lost from the potato.
0.4 mol = x, 0.6 mol = x + 1, 0.8 mol = x+2, etc. Where x = water loss
Evaluation:-
I believe that my measurements of the weight of the potato chip before and after the experiment where reasonably accurate, as I used an electronic balance which is very precise. My measurements for cutting the potato to 2cm length s weren’t that accurate as I was using a ruler (using my eyes), although the length wasn’t important, as I’ve already stated. However, the size may have been important, as even a small difference in shape may have given that potato chip more of a surface area, with which to increase the rate of osmosis, and vice versa.
At concentrations of 0.8 and 1.0 mol of sucrose solution, I seem to have abnormalities in my results. Instead of the potato chip reading a loss in mass due to osmosis, each time one of the two potato chips tested seem to have gained mass. This may have been caused by a number of things: the stopwatch not being read carefully or properly, the sucrose solution being of a different molarity through human error, an abnormality in the potato, balance read incorrectly. I believe that it was due to the balance being read incorrectly or through distraction as we had a limited time to carry out this experiment.
As this test was conducted using a limited range of apparatus, it can be improved in some ways. Firstly, the potato chips could be cut and measured accurately using an electronic device. Secondly, the potato could be removed using a pair of tweezers, and instead of blotting, could be left to drip for 30 seconds. Thirdly, I could have left the potato in the solution for a longer time period of 15 minutes, to get digger and easier to interpret patterns. I could also have used a larger mass of potato, but this would have sunk to the bottom of the solution and made retrieval difficult, giving some potato chips an unfair amount of time as I struggled to get it out of the beaker. Lastly, instead of rounding up the numbers, I could have worked with them as they were, and maybe I could have used an electronic balance that went up to 5 decimal places, for extreme accuracy.
I believe my data to be semi-reliable, although I did 2 repeats of each concentration of sucrose solution, this isn’t good enough. I would have preferred to do 5 repeats for ultimate accuracy. Also the timing was inadequate, as was the cutting of the potato. However, my graph at the end proves my prediction correct, and as my prediction relies on the action of osmosis to work, this means that my experiment must have also worked reasonably well.
To further research into osmosis and how it can be affected/ affects living things, there are other tests I could carry out. I could do a detailed study into the change of mass of a plant in earth. I would have to take a sapling of a plant, weigh this carefully, and then plant it. This plant would then be watered carefully, with a certain amount of water to be decided upon (a controlled factor). The plant would have to be covered to prevent evaporation. Throughout the experiment, a specific environment would have to be kept, to insure a fair test is carried out. At the end of a certain time period (about 2 weeks, perhaps) the plant would be dug out, washed briefly, and then weighed. This would tell you more about the rate of osmosis in plants, and how it affects their growth in mass.