R ∝ 1 x 1/A
Other Factors
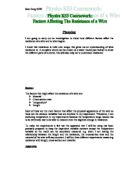
The other factors I could change when doing the experiment are the physical factors of a wire:
- Type of wire
- Diameter of wire
- Temperature of wire
If I were to use the type of wire as my variable factor, I would use several types of metal wire. These would possibly be constantan, copper and nichrome. In our experiment we are using constantan, this has a higher resistance than copper but not as much as nichrome.
The diameter of a wire is another physical factor of a wire, which can be changed to do this experiment. A thicker wire supposedly has less resistance than a thin wire and doubling the diameter, halves the resistance. This is because the current has more space to get past the atoms in the wire.
Temperature of a wire is another possible variable factor, which can seriously affect the resistance of a wire. The resistance in a wire would increase when the temperature does. This is because the atoms vibrate faster in more heat; therefore electrons collide with the atoms as they pass through a conductor.
Method
I am doing an experiment to work out how the length of wire in a complete circuit affects the resistance of the wire. The science I have gained implies that the longer wire will have more resistance. For the experiment I have decided to use a constantan wire on a wire-board as the basis for my experiment. The diameter of the wire I will use is 0.24 mm, which is a thin wire. We will do our best to keep the temperature the same throughout the experiment by not leaving the power pack on too long. This will prevent the wires from heating up or even burning. The circuit includes a power pack, which will be set at 2 VDC, wires, wire-board, crocodile clips, voltmeter and ammeter. This is how the circuit will be set up.
After the experiment is set up I will take the current and voltage at 10ccm, 20cm, 30cm, 40cm and 50cm. I will then work out the average current and voltage and then work out the resistance. I can then work out the resistance by using this equation:
Resistance = Voltage
Current
I will then be able to work out the resistance in ohms and then draw 2 graphs. One will be current against length and the other will be resistance against length. This will hopefully help me find out how the length of the wire affects the current and resistance of the wire.
Improving Accuracy and Fair Test
To improve accuracy and keep it a fair test I will firstly keep the power pack turned on for as short as possible. This is to stop heat affecting the results by warming up the wires and possibly reducing the resistance. I will also keep the power pack switched on to 2V to keep the temperature as low as possible and keep it on Dc to prevent any electric shocks. I will also ensure all crocodile clips and connections are secured to prevent current loss. When reading the voltmeter and ammeter I will round the digits up to 2 decimal places to make sure the average is as accurate as possible. To keep it a fair test I will only change 1 variable, the length of wire. Repeating the experiment 3 times and working out the average is also a way of keeping the experiment fair.
Preliminary Work
Before doing the experiment I am doing some preliminary work to see if everything works and get an idea of the range of lengths of wires to use. Here I have done some experiments to figure out which diameter of wire to use:
These results show that all of the diameters are suitable to use for my final experiment. For this reason I shall use 0.24mm wire because it is suitable and is in the middle of the 3 diameters. It also shows that the constantan wire is suitable and so is the range of wires.
Conclusion
I predicted that as the length of the wire increased, so will the resistance in the wire. This was because of the higher chance of collisions with atoms in a longer wire. Looking at my graph, I can tell that this was correct. I also predicted that as the length of the wire doubled, so would the resistance. The line of best fit on the graph shows that this is also fairly accurate. To prove this, at 20cm the resistance was 0.41 ohms compared to 20cm, which is was at 0.20 ohms. This is almost half the resistance, which proves my prediction was correct. Looking at the current against length of wire graph it is clear that the current goes down as the length of wire increases. I didn’t need a graph to show how my prediction on the voltage compares to the results. This is because I predicted that the voltage would stay the same throughout the experiment and it did. This was because the length of wire shouldn’t make a difference to the voltage needed.
Evaluation
Overall, my whole experiment went according to plan. I predicted that the resistance in the circuit would double as the length of wire did, this did occur but not perfectly. On the resistance against length of wire graph there is one clear anomaly at 20cm. On the current against length of wire graph there is one anomaly at 40cm. These anomalies could be popping up for a number of reasons: wires heating up; loose connections; faulty equipment such as wires, power pack, ammeter or voltmeter. Although I did my best to prevent these mistakes from occurring, I could not be sure. If I was to re-do the experiment I would keep the power pack on for as little time as possible to prevent the wires heating up. It is hard to control the heat of wires any other way or even test the heat, as it is unpractical to use a thermometer on wires. In future to prevent any loose connections of wires I would thoroughly check every connection by using a bulb as a tester. This would also work to check whether the equipment is working correctly. It is fine for me to say my experiment went well but I need to check somebody else’s results to see whether they are similar to mine. This group’s results were using exactly the same factors as me so I can compare the results better. Their results seem to go in the same direction of mine, proving that resistance in a wire increases with the length. However, the theory that as the length of wire doubles so does the resistance is not so clear with their work. For example, at 20cm the resistance was 0.43 and at 40cm it was 0.75. This is not far off but the difference between that of 10 and 20cm is. The resistance does not change. There is obviously something very wrong here as it is supposedly meant to double. This could be a loose connection or faulty wire that has been fixed later on. Compared to this groups results, my experiment ran smoothly and it shows that every experiment cannot run perfectly every time.