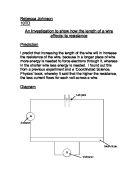
The key factors of this procedure will be measuring the current and voltage of the wire at different lengths. I will use only 1 Volt, because a high voltage will cause the wire to heat up which will affect the results. The current and voltage were measured at each length 3 times. The resistance will be calculated using the average of the three results. The supply voltage will be controlled and because only 1 volt is being used the temperature of the wire will stay low and not vary too much. The length of the wire will be changed, by the position in which the crocodile clip linked to the supply.
I predict that the longer the wire, the greater the resistance. This is because if the wire is longer, there will be more free electrons therefore, these free electrons will collide more frequently. Due to the fact that the particles are colliding more often more energy will be lost as heat in these collisions. I think that if the length of wire is doubled, the resistance across the wire shall also double because there are twice as many free electrons that will collide.
I chose to use 140 cm of wire and measuring every 10cm is so that it will show if there is an obvious pattern. If the results make a curved graph, it might not show over 1 meter but might over 1.4 meters.
In a preliminary experiment, I used a 9 Volt power supply. Due to the fact that the wire was bare and had no insulation/protection, the wire heated up very quickly. The wire was so hot it made the results invalid because the resistance is higher in a heated wire. These results were inaccurate and not used, because of the preliminary experiments, I only used a 1 Volt power supply. By using only 1V this avoided overheating and made a fair test. Between Measurement 1, 2 & 3, the wire will be disconnected for 10 – 15 minutes to cool down incase the wire has heated up.
By using the above methods, data was obtained. The readings were taken three times and an average used to calculate the resistance. I recorded the results in one table and included length, current, voltage and resistance. All three measurements plus the averages is shown so that any anomalies can be seen.
I found that all of our results had a steady pattern and I could not see any anomalies that stood out. Therefore, I did not feel the need to repeat any measurements.
Using the average made sure that the results would be more accurate. When an experiment is repeated, the more times it is repeated, the more accurate the results will be. Due to the fact that I repeated the experiment 3 times, this gave a result, which is more like the prediction.
After the first round of measurement had taken place, the second & third rounds of measurements were a lot quicker and were very similar.
The evidence I have obtained shows that length does effect the resistance of a piece of wire. The results show that the greater the length, the greater the resistance, therefore the shortest length of wire has the least resistance.
The graph has a positive correlation, which shows that as length increases, resistance increases.
The resistance increases as the wire length increases. This happens because a longer wire has more free electrons and so more thermal energy is lost by increased frequency of collisions. Wire is made to have the smallest resistance possible, this is because wire is used in electrical circuits and in order to have an efficient circuit the resistance on wire has to be low. If the wire tested were insulated with a plastic coat the resistance would be, even less because there would not be as much thermal energy lost.
The conclusion that resistance increases as length increases shows that my prediction was correct.
I believe that the investigation was successful and gave reliable and accurate results. I found that there were only 3 anomalies. These anomalies have been circled on the graph. These readings should be taken again and if the same results are found for the last three results for 120cm, 130cm and 140cm. If the same readings are given the investigation should be further extended to see if the resistance levels off.
By using the graph it shows that the resistance over a wire has a tendency for a straight line which means that in a wire at constant temperature, the voltage is directly proportional to the current.
I think that the experiment was accurate and gave reliable evidence and could be used again and expanded. To improve the investigation I would repeat the measurements up to 5 times to get a better average.
I think that the first round of measurements the voltage measured was a tiny amount less than rounds 2 & 3. This could have been because it was the first time and the wire was cold.
In increase of resistance could have been caused by faulty connection that would cause a resistance greater than it should be. Before each experiment, the connectors should be cleaned to make sure that the results are accurate and reliable.
To improve the investigation I would like to expand the testing for very large lengths of wire, up to 100m, and very small lengths of wire. Doing this would see if pattern is the same in all cases or if it changes at very large or small lengths of wire. In addition, it would be interesting to see the resistance over different lengths of insulated wire. By investigating with insulated wire, this will reduce the heat energy given out by collisions and therefore reduce the resistance. Also to repeat the investigation using wire of larger cross sectional area, or to use multi-strand wire.
Overall, I believe that the investigation was a great success and gave reliable evidence resulting in a sound conclusion.