The variables to be kept constant are:
-
Temperature. As enzymes work better/worse in different temperatures the test tube containing the reaction will be kept in a water bath, thus keeping the temperature the same throughout the experiment.
-
Size of potato. This must be kept constant throughout the experiment to ensure that roughly the same amount of catalase will be present. The surface area of the potato will also be kept constant throughout to ensure that there are equal areas for the catalase to react with in all the experiments.
-
Volume of hydrogen peroxide. To make sure that the amount of substrate the catalase has to break down stays regular, the hydrogen peroxide will be measured out for each experiment. This will keep the reactions fair.
-
Volume of buffer. This will be kept the same to keep the concentration of hydrogen peroxide constant.
J Neenan, page 3 of 9
-
Origin of the potato. Each piece of potato used should come from the same area of the same potato to ensure that there are regular amounts of catalase to react with the substrate.
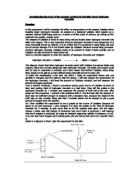
Method.
I will use a core borer to remove a cylindrical length of potato (this shall be used for each experiment, to ensure a fair test). This cylinder will then be cut with a scalpal into 5cm slices, and then cut again into 2mm slices to create a larger surface area. 25 of these 2mm slices will then be placed into 1ml of buffer for two minutes. This is to allow the buffer to soak thoroughly into the potato, allowing the catalase at the center to have the same pH as the catalase on the edge.
When the two minutes are up, 6ml of Hydrogen Peroxide will be added and the clock will be started. For the duration of a minute, I will be counting and recording the number of bubbles being given off at the far end of the delivery tube. At the end of the minute I will stop counting the bubbles.
I will repeat each and every experiment twice more to ensure an accurate result.
After every three experiments, the buffer shall be replaced with one with a higher pH. The first three experiments will have a buffer with a pH of 2, the second three experiments will have a pH of 4 and so on until the pH reaches 10.
I think this plan is the best way possible to carry out this experiment in my cicumstances as I rejected many other methods in a preliminary investigation before this practical. I tried a method where the gas was collected with a syringe, but it was stiff and therefore impractical. There was another method of recording the distance some liquid moved up a “U” tube, but this was inacurate.
J Neenan, Page 4 of 9
Safety.
As hydrogen peroxide is an irritant and a bleaching agent, lab coats and goggles shall be worn throughout the experiment. This will be in addition to absolute care when handling and standing close to hydrogen peroxide
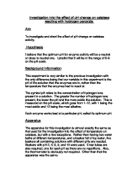
Hypothesis.
I predict that the experiment will start off very slowly because the solution is too acidic for the enzyme to work well but will gradually start to increase in pase as each experiment is performed. By pH 6-7 the experiment shall be reacting at full pace. (as this is the natural pH of the potato and enzymes work best at their natural pH.) After this level the experiment will start to slow down again because the solution will be too alkaline for the enzymes to work well.
Graph to show how the pH effects the rate of reaction of an enzyme.
To make sure that my results are accurate, I will be conducting each experiment three times, and then taking an average at the end.
The experiment and all of the units I chose for this test were chosen out of a process of elimination from a preliminary investigation carried out before the practical.All information in this test was either my own and from the website “Online Lab”.
J Neenan, Page 7of 9
Table of Results.
Conclusion.
The results of this experiment demonstrate clearly that the catalase has an optimum pH value of 7. Above and below this pH the reaction is affected and slows down considerably until at very low/high pH the catalase ceases to work.
The graph shows how, as the pH rises, the catalase slowly begins to become more and more effective until it reaches its optimum level at pH 7. It then drops away rapidly as the solution becomes increasingly alkaline.
Hydrogen peroxide is produced by various metabolic reactions within the potato cells. This is toxic and therefore needs to be destroyed quickly and efficiently. Catalase breaks down the hydrogen peroxide into harmless water and oxygen. To ensure that this procedure is carried out as quickly as possible, the pH must be kept at the enzyme’s optimum level. As my graph shows, in this case, the optimum level is 7.
My results are slightly different from my hypothesis in the way in which the experiment begins. I predicted that the experiment would have a very slow start, but my graph
J Neenan, page 8 of 9
clearly shows how the experiment has quite a steep climb, indicating a relatively quick start.
Apart from this, my experiment went as planned. The enzyme’s activity did peak at pH7 and the pace of the reaction did quickly decline.
Evaluation.
I feel that the experiment was very difficult to perform accurately and therefore was unsatisfactory. Although the experiment demonstrates the optimum pH of catalase adequately there are many aspects which could be improved upon. The potato pieces, although cut carefully, are bound to vary in surface area and catalase content. The method of measuring and slicing the potato is very inaccurate and time consuming. The method of measuring the volume of oxygen produced is crude and, although it gives an impression of the varying amounts produced at each pH level, the method of measurement is too inaccurate for a precise reading. Although these problems affected the results obtained, I feel that my results were within acceptable limits and demonstrated the point of the experiment adequately.
My method could be improved upon by regulating the amount of potato used and making the catalase content equal throughout the sample. This could be achieved by liquidising and weighing the potato sample.
Another improvement could be made by extending the range of pH buffers available thus resulting in a more demonstrative range of results. It would be both useful and interesting to know at which levels of pH the catalase is completely inactive.
There are two anomylous results in my graph. This is with the pH’s 7 and 9. The most likely explanation for these
J Neenan, Page 9 of 9
errors is that somehow the pH buffer had soaked in further on these experiments than on the others. This would result
in an accelerated rate of reaction and therefore would look out of place on the graph. Another problem with my result for pH 9 is that it has a very large margin of error. This is because my results for this experiment were very varied and inacurate. This can be explained by all the above imperfections in the experiment.
I could follow up this experiment by researching the effect of various temperatures on the action of catalase at its optimum pH. This would demonstrate the optimum conditions under which catalase works.