Get the vacuum in the calorimeter going before starting
Record the initial temperature of the calorimeter.
Do not use a maximum temperature for the heat capacity of around 30°C
Put the burner anther the calorimeter and light it.
When you get to the decided temperature put out the flame of the burner.
After measure again the mass of the alcohol used.
Put the results into the equation
The equation needs to be arranging for this calculation.
When finish with the calculations for the heat capacity of the calorimeter do the following.
Let the calorimeter cool down.
Measure some Ethanol and put it on a burner.
Record the initial temperature of the calorimeter.
Do not use a temperature greater or smaller than the final temperature used to calculate the heat capacity of the apparatus.
Use the same mass of water used to calculate the heat capacity of the calorimeter.
Put the burner anther the calorimeter and light it.
When you get to the decided temperature put out the flame of the burner.
After measure again the mass of the alcohol used.
Put the results into the equation .
Record all the information gotten on a chart.
When finish remake the experiment using Butanol and then Propanol instead of Ethanol.
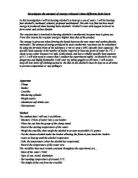
FIG. 1
This is the simple calorimeter that is used to see what’s the heat capacity of different materials that can be burn on it or their energy content.
Experimental data
Calculations of heat capacity of the apparatus
Chart 1
This is the equation used to calculate the heat resistance of the apparatus
Moles of Ethanol: 3.04/46
H of Ethanol= -1317 KJ per mole
H= 1317*(3.04/46)
C= (1317*3.19)/(46*270*34)
C=4003.68/422280
C=0.00995
This is going to be the value used of C in the equation so more accurate results are obtained for the experiment.
By using this value of C we are taking in account the heat resistance of water and the heat resistance of the calorimeter also this is why the results are going to be more accurate.
Experiment results chart
Chart 2
Energy calculations
Butanol
Energy=(590.18*0.00995*31.5)/(1.75/74)
Energy=7822 KJ mol-1
Propanol
Energy=(590.18*0.00995*32)/(1.58/60)
Energy= 7136 KJ mol-1
Ethanol
Energy=8590.18*0.00995*34)/(3.04/46)
Energy=3021 KJ mol-1
Energy data bar chart
Graph 1
Graph 1 has a limitation that is that the number of decimal points used to make it does not allow reading it properly and if the number of decimal points allowed on Graph 1 is increase it’s impossible to read team. This makes the reading of it a little hard.
This bar chart compares who much energy was calculated that these alcohols have
Alcohols energy line graph
Graph 2
This graph shows in another way the energy that the alcohols have store on their structure.
Energy release and number of carbon atoms in the molecule
Graph 3
This graph compares the number of carbon-hydrogen bonds in the alcohol molecules and the energy release in the combustion of these alcohols.
Structure of the alcohols used
Ethanol
Fig. 2
Propanol
Fig. 3
Butanol
Fig. 4
Procedure evaluation
The experiment came out fine but as in any experiment there were some errors when making it. The starting temperature was never the same sometimes it was 20°C and sometimes it was 22°C this creates some error in the calculation for the energy. Some of the heat produced by the alcohols when been burn got lost because the apparatus had some openings on it that let the air enter into the apparatus so combustion can occur. There could have been some errors when trying to find out the heat resistance of the apparatus because it was the first time that I used a calorimeter. There could be some mistake that pass unnoticed when recording the data for chart 1 and 2 that could have affected the hole experiment. Finally there was some unburned carbon on the alcohols this also add some error to the experiment.
Fig. 6
Improvements for the experiment
A bomb calorimeter (Fig. 6) could have been used so no heat could escape from the apparatus and it’s more accurate because there is a total combustion when the alcohols are burn in the calorimeter. The same starting temperature could have been use for every experiment to make them all fair and more accurate. More data of more alcohols could be used to determine if there could be a relation or a pattern between the alcohols and their structure.
Conclusion
As it can be seen from the results the bigger the molecule the more energy that it release when its burn, this is because the Van der Waals forces between the alcohol molecules increases as the molecule gets lager and in gains mass. So the stronger the Van der Walls forces between the alcohol molecules the more energy they release when the combust. These molecules are very similar to each other so it’s easy to notice which molecule is going to release more energy. The amount of bonds in the molecule also affects the energy that they can release in combustion, so the more carbon hydrogen bonds the molecule was the more energy that it will release in combustion. All this factors that affect the energy that this molecules release can be easily seen in Graph 1 and 2. Finally in Graph 3 the number of carbon-hydrogen bonds and the energy release by the three alcohols tested can be seen and a pattern appears the more carbon and hydrogen atoms the molecule has the more energy that is release when burn.