4. The experiment was carried out for the same amount of time with the different concentrations of the solution.
5. The entire experiment was carried out in the same place. Thus the temperature and environment remained constant.
6. The weighing balance, the knife and the scalpel were the same throughout the experiment.
Independent –
1. The concentration of the salt solutions.
Dependent-
1. The mass of the potato after after the experiment.
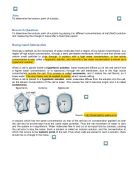
Procedure:
1. Take a raw potato and remove its skin.
2. Cut the potato into 15 pieces of similar sizes using the knife and a ruler
3. Arrange the potato strips in five groups of three each on the petri dish
4. Measure the mass of each strip on the digital balance
5. Put three strips in each of the salt solutions with different concentrations
6. Label the sets and leave the solutions for a day
7. Use the forceps and carefully remove the strips from the solution onto a dry tissue paper.
8. After drying the potato strips on the paper for some time, measure the mass of the strips once again and record your readings.
Data Processing:
1. Difference between masses=original mass-new mass
a. (0.78 - 0.71)g = 0.07g
b. (0.98 - 0.90)g = 0.08g
c. (1.46 - 1.21)g = 0.25g
2. Percentage difference = (difference between masses / original mass)*100
a. (0.07 / 0.71)*100 = 9.86%
b. (0.08 / 0.90)*100 = 8.89%
c. (0.25 / 1.21)*100 = 20.67%
3. Average % difference = Percentage Difference / No of Percentages
a. [(9.86)+(8.89)] / 2 = 9.38%
b. [(-33.33) + (-27.40) + (-27.62)] / 3 = -29.45%
c. [(-24.07) + (-22.88) + (-22.50)] / 3 = -23.15%
Processed Data Table:
Table showing the percentage differences in the masses of the potato pieces according to the concentration of the salt solution
Error Readings:
We have identified three errors in our readings-
- The +20.67% difference reading in the 0.0M concentration solution
- The -14.89% difference reading in the 0.2M concentration solution
- The -59.57% difference reading in the 0.4M concentration solution
We believe that these readings are errors due to the fact that the difference between these readings and the others two readings taken for the same concentration solution is very high.
We believe these errors occurred as the potato pieces taken were not originally of the same mass and thus the difference in their masses after the experiment affected their percentages in a different manner, making the percentages higher or lower. Also the pieces were of different lengths which changed the amount of surface area to absorb water.
We have not taken into account these anomalies while calculating the average percentage reading.
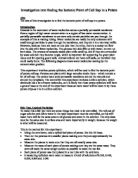
Graph Analysis:
According to our graph in the percentage difference is the most in the 0.6M concentration solution (-29.45%) and the least in the 2M concentration solution
(-3.00%). All the percentage differences are in negatives except for the 0M concentration solution percentage difference (+9.38%). The graph goes downwards till 0.6M and then goes upwards towards the 0.8M reading.
Conclusion:
According to our results, the mass of the potato pieces only increases in the 0.0M salt solution. It increases by 9.38%. This means that the solution was hypotonic at that point as the mass could have only increased if water concentration was higher outside the cell than inside, so that the water could rush in, making the cell swell.
According to our results, the mass of the potato pieces decreases significantly at 0.4M (-27.43%), 0.6M (-29.45%) and 0.8M (-23.15). This means that the solution was hypertonic at that point as the mass could have only decreased so significantly if the water concentration was higher inside the cell membrane than outside, so that the water could rush out, making the cell membrane shrink.
According to the percentage difference was the least at 0.2M (-3.00%). This means that the mass was more or less the same before and after the experiment. This is probably near its isotonic solution, as the concentration of the solution is nearly the same inside and outside the cell and the water molecules move in and out at the same rate.
However from our graph, we can conclude that the isotonic point was 0.13M, which is close to 0.2M. 0.13M is quite close to the literary isotonic point which is 0.1M, and is indeed rounded off to 0.1M
Thus we can conclude that the isotonic point of a potato is 0.1M.
Evaluation:
We should have taken more readings for our experiment to get a more accurate result as a lot of our result were erroneous and could not be used to gain the average percentage difference. This was a random error on our part.
We got wrong readings due to two reasons. Both were random errors-
- We did not measure the length of the potato strips before the experiment to make sure that they were the same. If we had done so, the surface area of the pieces would be the same, thus allowing the same amount of water to come in contact with the potato. Also we would have known if the length of the potato would have changed as well.
- We did not take pieces of exactly the same masses. If we had done so there would have been no need to take percentages. Also we could have been sure of the accuracy of our results.
We did not measure the amount of tissue paper we used to dry the potato pieces. If we had done so then we could have been sure that excess water did not remain on any strip, thus ensuring that there was no extra mass. This was also a random error made by us.
Thus there are various ways by which we can improve the accuracy of our results.