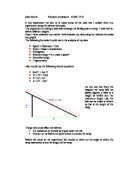
Before we could do the experiment we needed to work out the angle at which the ramp was aimed at and the length of the ramp
A² + B² = C²
92² + b² = 244²
B² = 244² - 92²
B² = 59536 – 8464
B² = 51072
B = Root (51072)
B = 225.99 = 226m
To work out the angle, which the ramp was aimed at, you have to use trigonometry
Cos θ = adjacent / hypotenuse
Cos θ = 226 / 244
θ = Cos ˉ¹ 0.926
θ = 22.1455
θ = 22.15º
I now must thing what was I asked to work out and what can I workout from mthe data collected.
I need to work out the acceleration of the ball. The gravitational pull of the earth is 9.81 Newton’s and the angel of the ramp is 22.15˚.
Weight of the ball = ma
W1 = MA = 28.09g x a1
W = MA + 28.09g x 9.81 ms ˉ²
Sin θ = opposite/ hypotenuse
= W1/W
= 28.09g x A
= 28.09 x 9.81 msˉ²
= a1 .
9.81 ms ˉ²
Acceleration = 9.81 x sin θmsˉ²
= 9.81 x sin 22.15msˉ²
= 3.70 msˉ²
What we did in the experiment:
The experiment needed the ball to be rolled down a ramp at a set angle to work out the acceleration of the ball.
First we had to measure the ramp and make off 20cm sections on it. These were the starting points for the ball. The results we got were repeated 3 times as to produce an average we, which could say, was pretty accurate. The angle at which the ramp was aimed at we made it low to the ground so that the ball didn’t roll down the ramp to fast for use to set off the timer and stop the timer.
As we had set up the ramp at a low angle to reduce speed we needed a timer, to make it a fair test the counter (the person holding the ball) counted from 3 to 1 then released the ball this gave us a accurate result. The people doing these jobs never swapped.
There are ways in which we could of improved this for example by using a laser timer.
The results were as follows:
The graph that my results produced wasn’t what I was expecting. After a while they results become a bit hard to predict what the next result will me. From the results that I collect I hope to calculate:
- The speed of the ball,
- Its acceleration,
- Power,
- Velocity,
- Kinetic and potential energy.
- The speed of the ball:
If we take our table and add the speed column:
Speed = distance x time
Eg. 0.2m x 0.29 = 0.06
Things that could have affected my results are:
Friction between the ball and the ramp. Friction would slow the ball down, and we cannot fully remove friction from the ball.
Air resistance could have had an effect on the ball bearing. The air resistance would act on the front of the ball slowing it down.
Errors by me as my reaction of timing the ball could have been out. To overcome this I could of timed my reaction of switching a stopwatch on then off and taking that away from the results that we got.
The surface, which the ball was rolled down, could have been uneven and as the ball was rolled at different places this could have had an effect.
GRAPHS
- This graph is a distance time graph- the graph was a smooth curve. When I added a line of best fit the points were all close to the line. Time is proportional to the distance that the ball has travelled.
- Graph 2 Shows force over acceleration. To have acceleration you need a big force.
- Graph 3 had a funny middle in it with a hump. I added a straight line but it still didn’t look right. I am not sure why this happened.
- The distance over acceleration graph produced a straight line as you would expect as distance is proportional to the acceleration to the ball
- Speed against distance graph produced a smooth curve.
- Velocity against time started as a smooth curve but in the middle the velocity went up and then smoothed out. The higher the ball the greater the velocity
- Distance against potential energy, the higher the ball the greater potential energy it has.