The following causes are the explanations for this rate to stop increasing. There are three possible answers.
- The photosynthesis process is going at the fastest possible rate, and no amount of additional light will make it go any faster whatever the circumstances.
- There is insufficient carbon dioxide available to allow the process to speed up any further.
- The temperature is too low for the photochemical reactions to go any faster.
A way of illuminating an explanation for the rate of photosynthesis to stop increasing is to change the other limiting factors. These are temperature and carbon dioxide concentration.
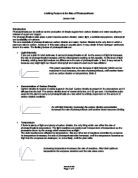
The results of doing this are shown in the graph below.
Curve (a) is the initial curve taken from increasing light intensity then the rate of photosynthesis leveling off. If this experiment was to be carried out with the same concentration of carbon dioxide but at a higher temperature (30°C rather than 20°C ) curve (b) is produced which is virtually identical to curve (a). This shows that it cannot be temperature which is preventing the process from going any faster.
However, if the temperature is constant and the carbon dioxide concentration is increased to 0.13%, curve (c) is obtained: the rate of photosynthesis rises to a maximum which is more than double that achieved at the lower carbon dioxide concentration. This shows that carbon dioxide was a limiting factor against increasing the temperature.
What is limiting the process where curve (c) flattens out? Curve (d) shows that in this case the rate of photosynthesis is increased by raising the temperature, therefore indicating that temperature is the limiting factor where curve (c) flattens out.
Identifying these individual limiting factors can be put into a general statement, called the ‘Law of Limiting Factors’. When a chemical process depends on more than one essential condition being favorable, its rate is limit by that factor which is nearest its minimum value. In the graph below, light in the limiting factor where the curves are rising.
When the curves flatten out we know that some other factor is limiting the process.
The effect of all these individual limiting factors can change the photosynthetic rate and also plant growth/production in both natural and man made habitats.
If the conditions that the plant needs are improved the rate of photosynthesis ‘should’ increase. (1)
The maximum rate of photosynthesis will be constrained by a limiting factor. This factor will prevent the rate of photosynthesis from rising above a certain level even if other conditions needed for photosynthesis are improved. This limiting factor will control the maximum possible rate of the photosynthetic reaction.
The amount of water available to the plant will affect the rate of photosynthesis. If the plant does not have enough water, the plant's stomata will shut and the plant will be deprived of CO². It is difficult in normal lab conditions to prove that water directly affects photosynthesis unless a heavy isotope is used to trace the path of water.
Chlorophyll is needed for photosynthesis. This can be proved by studying a variegated leaf. It is however very difficult to study how different levels of chlorophyll in the plant will affect it's photosynthesis rate. This is because in a variegated leaf the cells either contain chlorophyll or they don't.
Carbon dioxide concentration will directly affect the rate of photosynthesis as it is used in the photosynthesis reaction. It is also easy to change the amount of carbon dioxide that the plant receives.
Light is also directly used in the photosynthesis reaction and is easy to change in normal lab conditions. Carbon Dioxide and Light are the factors that I will change in the experiment as they are easy to change and measure.
Photosynthesis and the Environment
Limiting factors are of great importance to plants in their natural surroundings. The concentration of carbon dioxide in the atmosphere does not vary much, but in temperate regions light and temperature fluctuate considerably both in the course of a day and from one season to another.
On a warm summer day, light and temperature are generally well above their minimum value for plants living in the open, and carbon dioxide is the factor limiting photosynthesis. But in the cool of the early morning or evening, light or temperature may become limiting factors, as they do in the winter.
Habitat is also important: for plants living in shady place such as the floor of a forest or wood, light will be the limiting factor most, if not all, the time. Probably the most important single factor controlling photosynthesis is light: even a small change in illumination can make a considerable difference to the rate of photosynthesis.
Plants often compete for light, endeavouring to put them selves in a situation which provides enough illumination for their needs. The most obvious adaptation for obtaining plenty of light is to be tall. This is most clearly seen in trees, but the sturdy, erect stems of herbaceous plants like nettles and willowherbs achieve the same effect, lifting their leaves into a well-lit position for photosynthesis.
Their great height makes taller trees like beech and oak the dominant plants of a temperature woodland community, through for their sheer size the most adapted tree is the Californian redwoods which can reach heights of over 100 metres. This is an excellent example of how plants can adapt to certain limiting factors, in this case, light intensity.
Plants which live in the shadow of taller trees and shrubs resort to various strategies for obtaining sufficient light. Climbing plants like Clematis, honey suckle and ivy have twining stems and/or tendrils enabling them to ‘scramble’ towards light.
Certain woodland plants grow to maturity and flower in early spring before the leaves come out on the trees. Some woodland plants, such as primroses can photosynthesize at very low illumination and can therefore survive in relatively dark places.
In order to survive a green plant must receive sufficiently intense light for sufficiently long to replenish its supplies of carbohydrates, which have been lost by respiration. When photosynthesis and respiration proceed at the same rate so that there is no net loss/gain of carbohydrate, the plant is said to be at its ‘compensation point’.
The time taken for a plant to reach its compensation point, having been in darkness, is called the ‘compensation period’. The length of this period varies with different plants and conditions. With their greater ability to utilize dim light, shade plants generally reach their compensation point earlier in the day then those requiring bright sunlight.
This shows the inputs and outputs of the photosynthetic process.
The primary productivity of a is the amount of biomass produced through photosynthesis per unit area and time by plants, the primary producers. Primary productivity is usually expressed in units of energy (e.g., joules m -2 day -1) or in units of dry organic matter (e.g., kg m -2 year -1).
Globally, primary production amounts to 243 billion metric tons of dry plant biomass per year. The total energy by plants in a community through photosynthesis is referred to as (GPP). Because all the energy fixed by the plant is converted into sugar, it is theoretically possible to determine a plant's energy uptake by measuring the amount of sugar produced.
A proportion of the energy of gross primary productivity is used by plants in a process called . Respiration provides a plant with the energy needed for various plant physiological and morphological activities. The general equation for respiration is:
Subtracting respiration from gross primary production gives us (NPP), which represents the rate of production of biomass that is available for consumption () by organisms (bacteria, fungi, and animals).
Globally, patterns of primary productivity vary both spatially and temporally. The least productive ecosystems are those limited by and water like the deserts and the polar tundra.
The most productive ecosystems are systems with high temperatures, plenty of water and lots of available soil nitrogen.
The table below describes the approximate average net primary productivity for a variety of ecosystem types.
Factors Limiting Primary Productivity
Although all biological activity in plants is ultimately dependent on received solar radiation, it is obvious that solar radiation alone does not determine primary productivity. All plants require sunlight, carbon dioxide, and water for photosynthesis.
Photosynthesis is also dependent on temperature and soil . Temperature (heat) controls the rate of plant which in turn determines the amount of photosynthesis that can take place. Most biological metabolic activity takes place within the range 0 to 50 degrees Celsius.
There is little activity above or below this range. The optimal temperatures for productivity coincide with 15 to 25 degrees Celsius optimal range of photosynthesis.
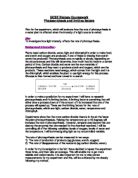
This graph illustrates the relationship between the net primary productivity of forests with annual air temperature.
Relationship between forest net primary productivity and annual temperature
Adapted from H. Lieth. 1973. Primary production: terrestial ecosystems. Human Ecology 1: 303-332.
The general relationship between net primary productivity and for forests of the world is shown in the following graph.
Relationship between forest net primary productivity and annual precipitation
Adapted from H. Lieth. 1973. Primary production: terrestial ecosystems. Human Ecology 1: 303-332.
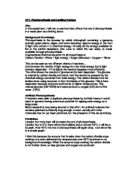
This Moderate Resolution Imaging Spectroradiometer (MODIS) allows scientists to gauge our planet's metabolism on an almost daily basis. This composite image over the continental United States, acquired during the period March 26th April 10, 2000, shows regions where plants were more or less productive i.e., where they 'inhaled' carbon dioxide and then used the carbon from photosynthesis to build new plant structures.
The false-color image below provides a map of how much carbon was absorbed out of the atmosphere and fixed within land vegetation. Areas colored blue show where plants used as much as 60 grams of carbon per square meter. Areas colored green and yellow indicate a range of anywhere from 40 to 20 grams of carbon absorbed per square meter. Red pixels show absorption of less than 10 grams of carbon per square meter and white pixels (often areas covered by snow or masked as urban) show little or no absorption.
This is one of a number of new measurements that MODIS provides to help scientists understand how the Earth's landscapes are changing over time. Scientists' goal is use of these GPP measurements to refine computer models to simulate how the land biosphere influences the natural cycles of water, carbon, and energy throughout the Earth system.
Bibliography
-
Interaction of Factors Controlling Photosynthesis graph taken from M.B.V. Roberts (1986) ‘Biology a Functional Approach’, 4th edition.
-
H. Lieth. 1973. Primary production: terrestial ecosystems. Human Ecology 1: 303-332.
- MODIS Image taken from Visible Earth, NASA
http://visibleearth.nasa.gov/cgi-bin/viewrecord?990