There are two factors to my experiment therefore there will be two predictions.
Prediction 1
As the length increases the resistance increases. I know this because the wire tends to resist the movement of electrons in it. As the length increases, the number of atoms increases so as the atoms vibrate fewer electrons pass through because the electrons lose energy.
Prediction 2
As the cross sectional area increases the resistance increases. When the current starts the electrons have more places to pass through the atoms because there are holes in where the electrons can pass through.
Apparatus:
The apparatus I will be using will be electrical wires, an ammeter, a voltmeter, a rheostat, a battery, a metre rule and the piece of wire.
Method (1)
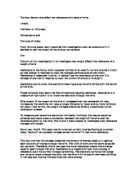
- I will set up my circuit with an ammeter, voltmeter, battery, a rheostat, electrical wires, the ruler and the piece of wire, as shown in the diagram.
- I will place the wire I am testing in the circuit, adjust the rheostat to set the current, then I will read off of the ammeter and voltmeter and then apply the formula: resistance = potential difference (V)
Current (A)
To work out the resistance for each length
Method (2)
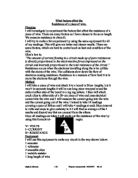
- I will set up my circuit with an ammeter, voltmeter, battery, a rheostat, electrical wires, the ruler and the piece of wire, as shown in the diagram.
- As I am testing the resistance of different thicknesses of the wires;
- 22 SWG
- 26 SWG
- 28 SWG
- 30 SWG
- 32 SWG
I will place the wires one by one in the circuit and then take the readings to work out the resistance = potential difference (V)
Current (A)
Safety
There is not much safety to be precautious of; I will just make sure that I do not get an electrical shock.
Results (1)(28 SWG)
Results (2) (thickness)
Analysis.
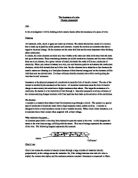
In the graph that is titled, ‘Graph showing resistance at different lengths’ the points form a straight line diagonally. The line of best fit starts from zero and it goes up in a straight line; there are no points that are far away from the line of best fit. This graph tells me that the shorter the length of the wire, the less resistance there is. I can back this theory up by saying that at 100cm the resistance is high at 5.5, but at 10cm the resistance is only at –0.67 On the graph labelled, ‘Graph showing resistance at different thicknesses,’ you can see that none of the points fall into the line of best fit. Three of the points are fairly close to the line, but the fourth one is very far from the line of best fit. This is an anomalous result. I do not know what has caused this point to be an anomalous result but I should have taken more precaution, or maybe the thickness I had used was not correct.
So By performing this experiment I have found out that the higher the length of the wire the greater the resistance will be. This conclusion matches my prediction, so I made the correct prediction at the planning stage.
Evaluation.
In only the graph labelled ‘Graph showing resistance different thicknesses’ there was one anomalous result, one of the points was way outside the line of best fit.. If I was to get another chance to carry out this experiment I would make sure that I would make sure I set the resistor correctly because I had to carry out the length experiment twice because the wire had set alight the first time.
Better I could carry out this experiment is that I could have done it in an area by myself so that I could’ve concentrated properly.