From this I can then work out the mean time the trolley takes to travel between each light gate,
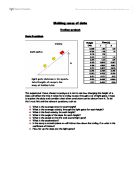
I have drawn a graph to show the relationship between height and time
From this graph I can see that as height and time are proportional as when height increases time decreases. However as it is not a straight line graph, it does not tell me much. I will find the logs of height and time and draw and see if this will get me a straight line graph.
From this I can get the equation
Using logs I know that: (Where (t)=time, (h)= height and (n) and (a) are unknowns)
I know that the formula of a straight line is, so if I substitute the logs we get,
Where (t)= y axis (n) = gradient, (h) = x axis and (a) + the y intercept.
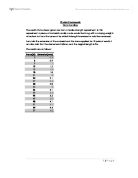
Before I plot my graph I need to find the logs of the mean heights and times, these are shown in the table below.
From these values I can then draw the graph.
From the formula , I can get an average gradient of -1.2304 and a y intercept of -1.7311.
As I have an average for the time it took for the trolley to travel between light gates, it is possible to find the average velocity between the light gates for each height.
I can do this using
I believe that the differing factor making the speed increase is height. To see if this is correct I have drawn a graph showing the relationship between height and velocity
From the graph I can see that as the height increases, so does the velocity. However I think I will learn more if the graph where a straight line. To do this I will use velocity squared, as shown below:
I can now draw the graph
From this graph I can see that it now forms a straight line graph. The gradient is 35.88 and the y intercept is 2.0657. This means that the friction involved is negligible and the ramp acts essentially as a smooth plane.
As well as height another factor influencing the velocity between the light gates is the angle of the slope. I can calculate this using trigonometry.
For all of the other heights,
Using Excel formula (=ASIN(K3/2)*180/PI())
I can then plot the graph
From the graph I can see that the velocity and the angle are directly proportional. This means that as the angle is greater then the velocity is too.
If I resolve the forces involved I can find the acceleration between the light gates as well.
Using height 0.088m
I know the speed is 0.52m/s
I know g(gravity) = 9.8
I know theta = 2.52
This means that acceleration is 0.43. This is only the theoretical acceleration as it will change but I will take this as a constant throughout the slope.